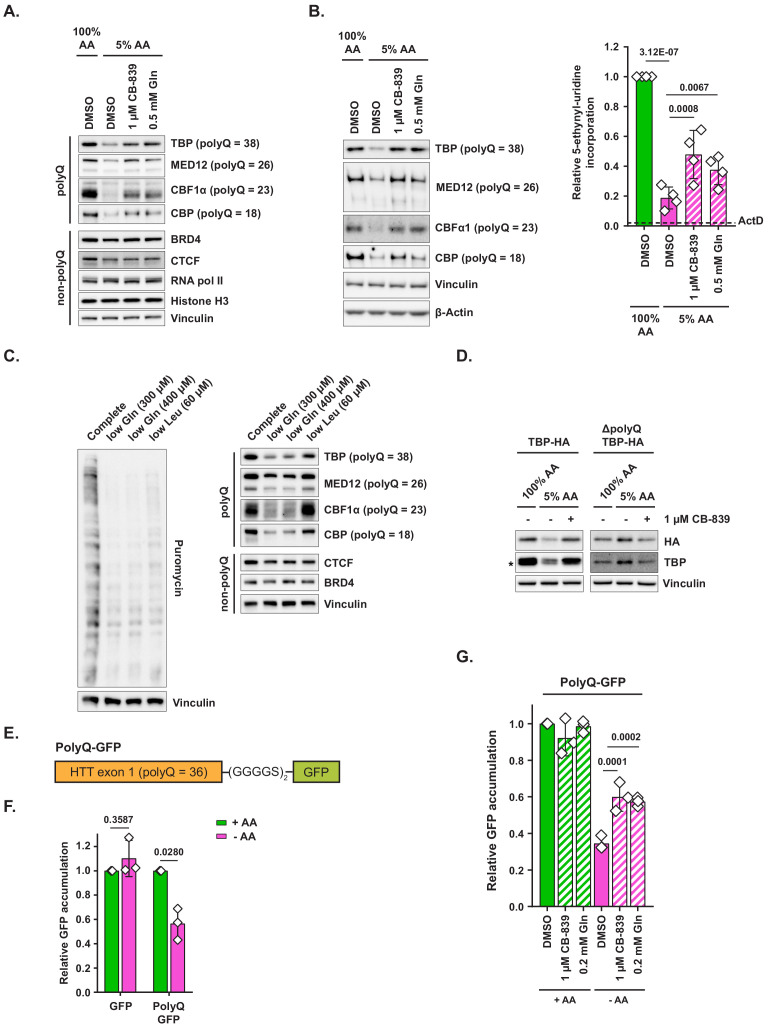
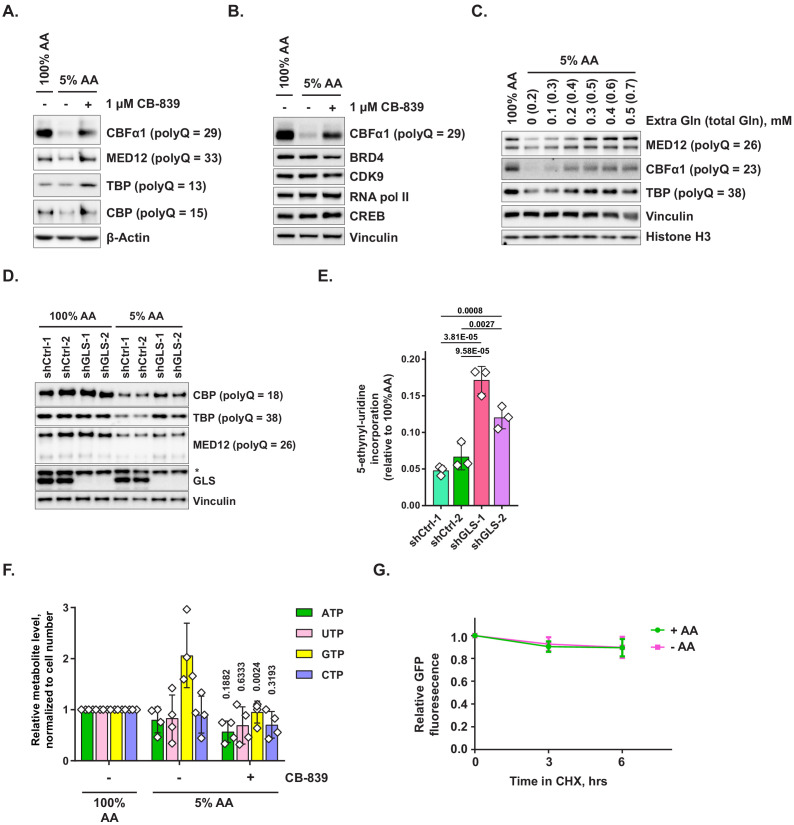
Figure 4. Polyglutamine-tract-containing proteins are depleted from amino-acid-deprived cells and can be recovered by glutaminase inhibition or glutamine addition.
(A) MiaPaCa2 cells were treated as shown for 48 hr. Levels of indicated proteins were examined by western blotting. A representative result (out of three independent experiments) is shown. (B) MiaPaCa2 cells were treated as indicated for 72 hr and nascent RNA synthesis was monitored by 5-ethynyl-uridine (5-EU) incorporation. Levels of indicated polyQ proteins were concurrently measured by western blot. Dotted line represents the relative value of 5-EU incorporation in cells in which transcription was arrested via actinomycin D (ActD) pretreatment for 10 min prior to adding 5-EU. Data are shown as mean ± SD of N = 4 biological replicates. (C) MiaPaCa2 cells were treated with media containing reduced quantities of glutamine or leucine or with complete medium for 48 hr, at which point new protein synthesis was assayed by puromycin incorporation. Levels of indicated polyQ and non-polyQ proteins were determined by western blotting in a parallel set of identically treated samples. A representative result (out of three independent experiments) is shown. (D) MiaPaCa2 cells were transduced with an empty retroviral vector, HA-tagged recombinant TBP (TBP-HA) or HA-tagged recombinant TBP with polyQ tract deleted (ΔpolyQ TBP-HA). Cells were treated as indicated for 48 hr, and levels of recombinant and endogenous TBP were determined by western blot. An asterisk indicates endogenous TBP. A representative result (out of three independent experiments) is shown. (E) A diagram depicting PolyQ-GFP reporter design. (F) Mouse embryonic fibroblasts (MEFs) were transduced with an inducible GFP or PolyQ-GFP construct in a retroviral vector. Cells were treated with complete or amino-acid-free DMEM in presence of doxycycline for 6 hr. GFP fluorescence was measured by FACS. Data are shown as mean ± SD of N = 3 biological replicates. (G) MEFs transduced with the PolyQ-GFP construct in a retroviral vector were treated with doxycycline-containing complete or amino-acid-free DMEM in presence of 1 μM glutaminase inhibitor CB-839, 200 μM L-glutamine + DMSO, or DMSO alone for 6 hr. GFP fluorescence was measured by FACS. Data are shown as mean ± SD of N = 3 biological replicates. p-Values were calculated by one-way ANOVA with Holm-Sidak post-test (B,G) or by paired Student’s t test (F). See also Figure 4—figure supplement 1.


