. 2020 Nov 16;9:e61467. doi: 10.7554/eLife.61467

Figure 2. Cryo-electron microscopy (cryo-EM) reconstruction of Saccharomyces cerevisiae THO-Sub2 homodimer.

(A) Segmented cryo-EM reconstruction of the THO-Sub2 dimer. Three different views are shown; proteins and domains are colored as in Figure 1A. Features discussed in the text are indicated, including the proximal and distal sides of the asymmetric homodimer, the rigid and flexible protomers, as well as the ‘head and ‘body’ of each protomer. (B) Cartoon representation of the structure, shown in the same orientations and colors. Helices are rendered as solid cylinders. (C) Schematic representation of the THO-Sub2 complex architecture based on the cryo-EM structure. (D) Two frames of the raw cryo-EM data outputs from the variance analysis shown in Video 1. The Tho2 C-termini of the two protomers are shown in orange and green. Different conformations are adopted as the dimer switches the proximal and distal sides.

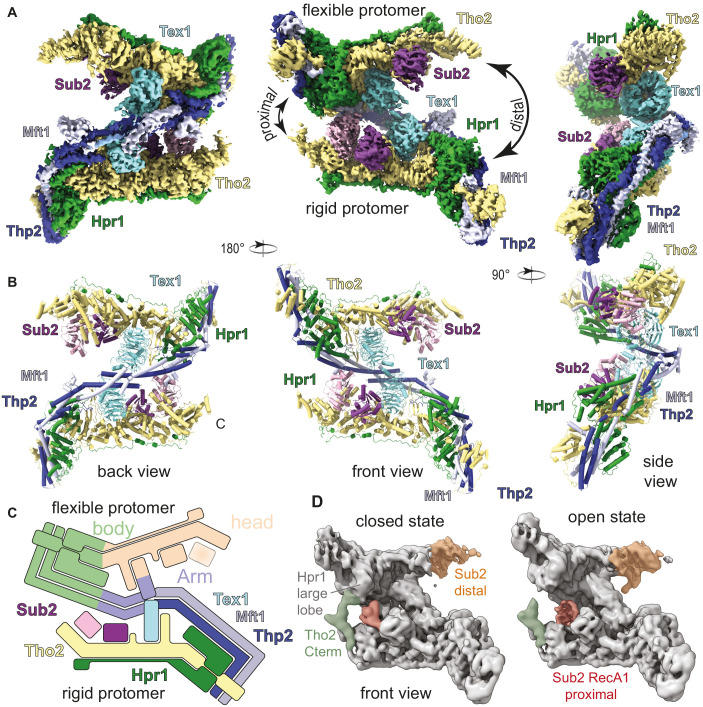
Figure 2.

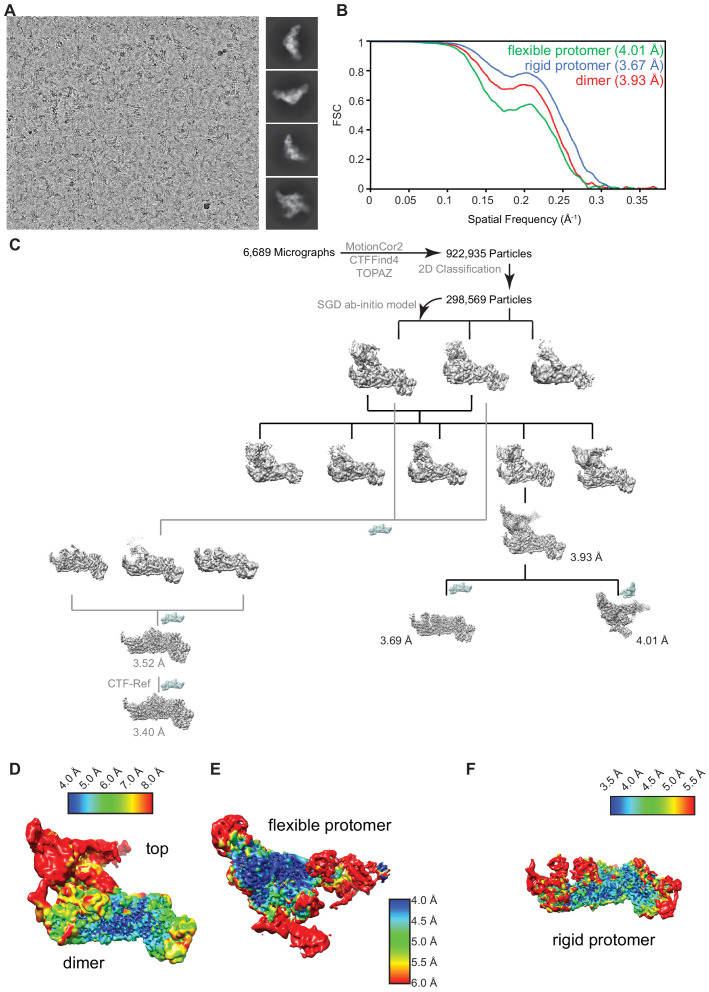
Figure 2—figure supplement 1. Cryo-electron microscopy analysis.

Figure 2—figure supplement 1.

(A) Representative micrograph acquired on a 300 keV Titan Krios equipped with a post-GIF K3 detector (Gatan, 5760 × 4092 pixel) showing particle distribution and reference-free 2D class-averages. (B) Gold-standard Fourier shell correlation (0.143 – FSC) plot from the final round of refinement for the entire map (THO-Sub2) and the two independently refined maps (rigid protomer and flexible protomer). (C) Particle sorting and classification tree used for 3D reconstruction of the THO-Sub2 complex. The major analysis branch (black) outlines the processing of the dimeric THO-Sub2 complex. The rigid and flexible protomers of the dimeric THO-Sub2 complex were refined locally after density subtraction. The minor analysis branch (gray) outlines the processing focused on the rigid protomer of THO-Sub2. The resolution and map quality were improved using local per-particle CTF-correction (see Figure 2—figure supplement 2). (D) Local resolution analysis of dimeric THO-Sub2, the flexible protomer (E), and the rigid protomer (F) after density subtraction and local refinement. Maps show variation in local resolution as estimated by cryoSPARC.
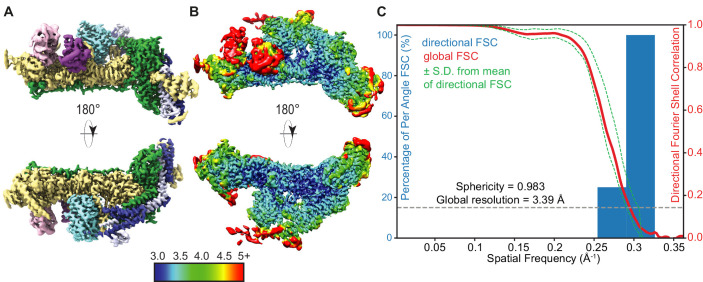
Figure 2—figure supplement 2. High-resolution THO-Sub2 density.

Figure 2—figure supplement 2.

(A) Segmented cryo-electron microscopy reconstruction of the rigid THO-Sub2 protomer used for de novo atomic modeling. Front and back views are shown; proteins and domains are colored as in Figure 2. (B) Local resolution analysis as estimated by cryoSPARC of the high-resolved rigid THO-Sub2 protomer. (C) 3D FSC and preferred orientation analysis of the rigid THO-Sub2 protomer density calculated using the ‘Remote 3DFSC Processing Server’ web interface. The red line represents the estimated global FSC of 3.39 Å ± 1 SD (green dashed lines). The sphericity of 0.983 indicates a uniform isotropic map without preferred particle orientation bias.
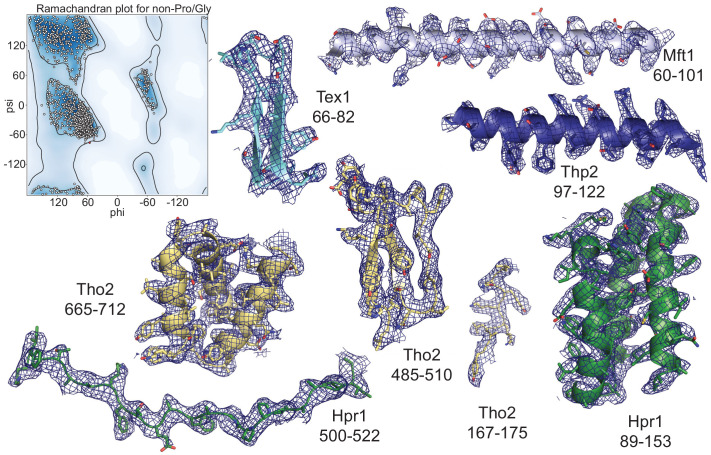
Figure 2—figure supplement 3. Model quality.

Figure 2—figure supplement 3.

Left: Ramachandran plot of the main-chain φ and ψ torsional angles of the rigid protomer THO-Sub2 atomic model. Areas of favored φ and ψ combinations are defined in dark blue (see also Supplementary file 1). Right: Representative regions of the THO-Sub2 (same colors as in Figure 2) and surrounding electron density maps are shown. Subunits and residue numbers are specified. Snapshots are shown for the density of both folded regions and extended regions.
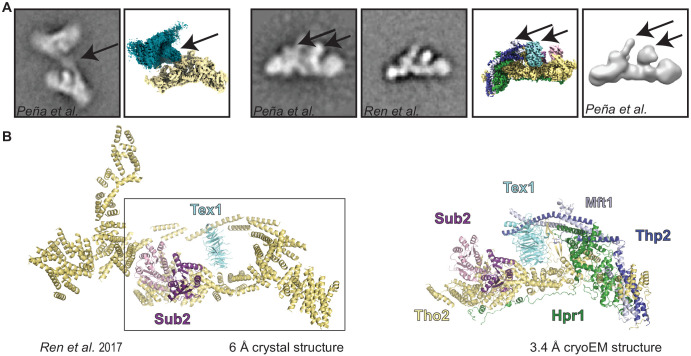
Figure 2—figure supplement 4. Comparison of our cryo-electron microscopy structure with previous structural studies.

Figure 2—figure supplement 4.

(A) Comparison with a previous negative-stain analyses of the THO complex (Peña et al., 2012; Ren et al., 2017). Arrows highlight areas with distinctive features in the 2D class-averages and our reconstruction. Overall there is a good agreement between the negative stain electron microscopy analysis and our structure. (B) Comparison with a previously published low-resolution X-ray structure (Ren et al., 2017), where the polypeptides for Tho2, Hpr1, Mft1, and Thp2 could not be distinguished, and are therefore all colored the same. The rectangle comprises the portion of the previous model that corresponds to a protomer. The other region of the previous model resulted from misinterpretation of the crystal lattice.