. 2020 Dec 8;9:e59616. doi: 10.7554/eLife.59616

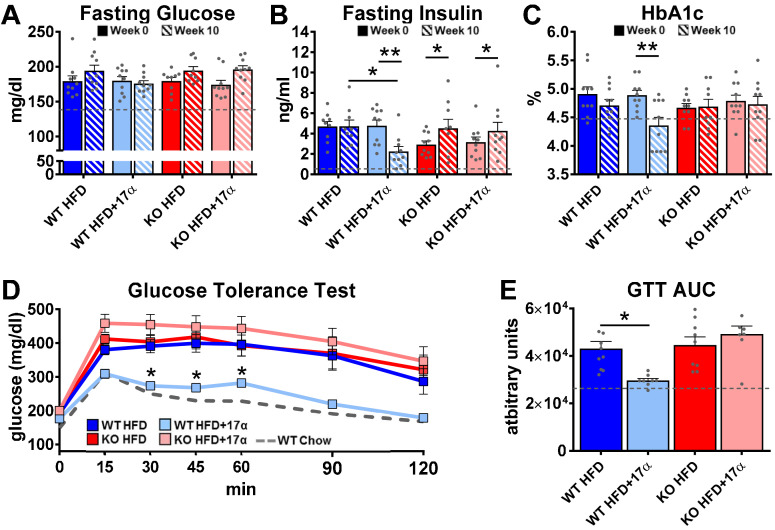
Figure 3. 17α-E2 reverses obesity-related metabolic dysfunction in male WT, but not ERα KO, mice.

(A) Fasting glucose (mean ± SEM, two-way repeated measures ANOVA), (B) Fasting insulin (mean ± SEM, two-way repeated measures ANOVA with Holm-Sidak post-hoc; *p<0.05, **p<0.005), and (C) glycosylated hemoglobin (HbA1c) at baseline (week 0; solid) and week 14 (striped) in WT and ERα KO mice provided 45% HFD (TestDiet 58V8)±17α-E2 (14.4 ppm) (mean ± SEM, two-way repeated measures ANOVA with Holm-Sidak post-hoc; **p<0.005). (D) Glucose tolerance testing (GTT; 1 mg/kg) (mean ± SEM, two-way repeated measures ANOVA with Holm-Sidak post-hoc; *p<0.05 between WT HFD and WT HFD+17α), and (E) GTT AUC during week 10 of the study (mean ± SEM, two-way ANOVA with Holm-Sidak post-hoc; *p<0.05). Age-matched, male WT, chow-fed (TestDiet 58YP) mice were also evaluated as a normal-weight reference group and the corresponding means are depicted as dashed gray lines. n = 9–10 (WT HFD), 8–10 (WT HFD+17α), 9–10 (KO HFD), 8–10 (KO HFD+17α), 12–15 (WT Chow).

Figure 3.

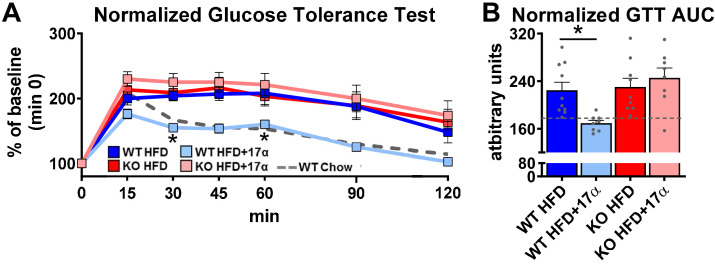
Figure 3—figure supplement 1. 17α-E2 reverses obesity-related metabolic dysfunction in male WT, but not ERα KO, mice.

Figure 3—figure supplement 1.

(A) Glucose tolerance testing (GTT; 1 mg/kg), normalized to baseline (min 0) (mean ± SEM, two-way repeated measures ANOVA with Holm-Sidak post-hoc; *p<0.05 between WT HFD and WT HFD+17α), and (B) Normalized GTT AUC in WT and ERα KO mice provided 45% HFD (TestDiet 58V8)±17α-E2 (14.4ppm) for 10 weeks (mean ± SEM, two-way ANOVA with Holm-Sidak post-hoc; *p<0.05). Age-matched, male WT, chow-fed (TestDiet 58YP) mice were also evaluated as a normal-weight reference group and the corresponding means are depicted as dashed gray lines. n = 10 (WT HFD), 8 (WT HFD+17α), 9 (KO HFD), 8 (KO HFD+17α), 12 (WT Chow).
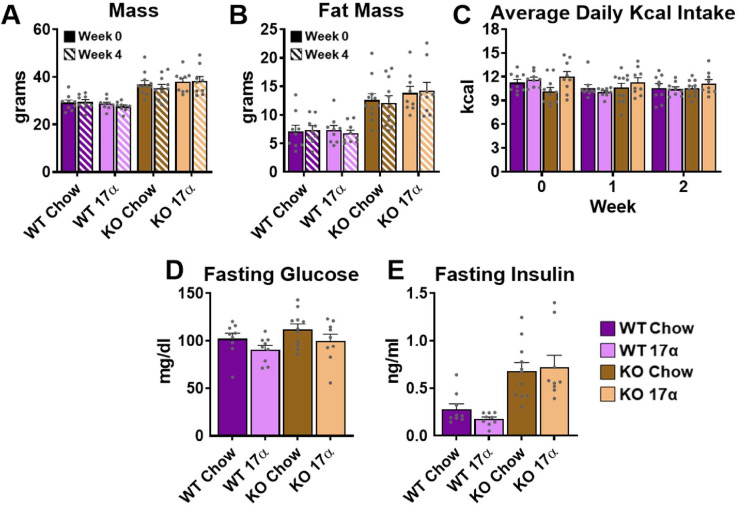
Figure 3—figure supplement 2. 17α-E2 fails to alter metabolic parameters in WT or ERα KO female mice.

Figure 3—figure supplement 2.

(A) Mass at baseline (week 0; solid) and week 4 (striped) (mean ± SEM, two-way repeated measures ANOVA), (B) Fat mass at baseline (week 0; solid) and week 4 (striped) (mean ± SEM, two-way repeated measures ANOVA), (C) Average daily calorie intake per week (mean ± SEM, two-way repeated measures ANOVA), (D) Fasting glucose during week 4 (mean ± SEM, two-way repeated measures ANOVA), and (E) Fasting insulin during week 4 in WT and ERα KO female mice provided chow (TestDiet 58YP)±17α-E2 (14.4ppm) (mean ± SEM, two-way repeated measures ANOVA). n = 9 (WT Chow), 9 (WT 17α), 11 (KO Chow), 9 (KO 17α).