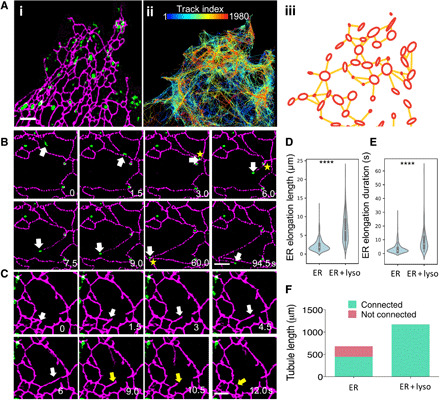
Fig. 1. Dynamic ER tubules are coupled to motile lysosomes.

(A) (i) SIM images of a COS-7 cell with EGFP-VAPA–labeled ER (magenta) and SiR dye-labeled lysosomes (green). (ii) SPT of lysosome motion over 12.5 min at 1.5 s per frame, color-coded by track index. (iii) Track density map extracted from SPT data (see movie S1). (B) Coupled motion (white arrows) of the growing tip of a newly formed ER tubule and associated lysosome. The tip forms three-way junctions (yellow stars). See movie S3. (C) An ER tubule, without an associated lysosome, is unstable and retracts (yellow arrows) after a period of elongation (white arrows). See movie S4. (D) Violin plot of ER tubule growth, in a 90-s interval, for growing tips with or without lysosomes attached. (E) Violin plot of maximum duration of the elongation phases of newly formed lysosome-coupled or lysosome-free ER tubules. (F) Sum of the total tubule growth lengths for lysosome-coupled or lysosome-free growing ER tips. Light green, tubules making network connections; red, tubules failing to connect. ****P < 0.0001, Student’s t test in (D) and (E). Scale bars, 2 μm (A to C). For (D) to (F), N = 481 events in 39 cells; see table S1.
