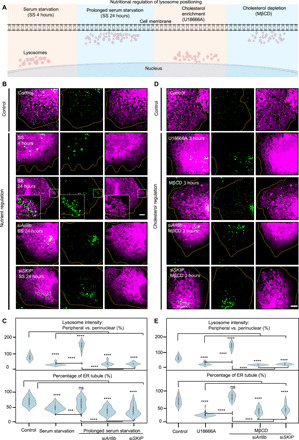
Fig. 4. Lysosome-mediated ER reshaping is responsive to nutritional status.

(A) Schematic representation of the nutritional regulation of lysosome positioning. (B) Representative SIM images showing the distribution of lysosomes (green) and ER (magenta) upon disruption of metabolic pathways, same for (D). From top to bottom: no treatment control; 4-hour serum starvation (SS; same in the following text); 24-hour serum starvation (prolonged starvation), see movie S7; siRNA against Arl8b or SKIP in prolonged starvation. (C) Violin plots of SiR-Lysosome fluorescent intensity and percentage of the ER comprising tubules with indicated treatments. (D) From top to bottom: 3-hour U18666A (10 μM) treatment to block lysosome-to-ER cholesterol transfer; 3-hour MβCD (100 μM) treatment to perturb cholesterol sensing; siRNA against Arl8b or SKIP in 3-hour MβCD (100 μM) treatment. (E) Violin plots of SiR-Lysosome fluorescent intensity and percentage of the ER comprising tubules with indicated treatments. ****P < 0.0001, Tukey’s one-way ANOVA. n ≥ 20 cells per condition from three independent experiments, same for (C). See table S6. Scale bars, 5 μm. ns, not significant.
