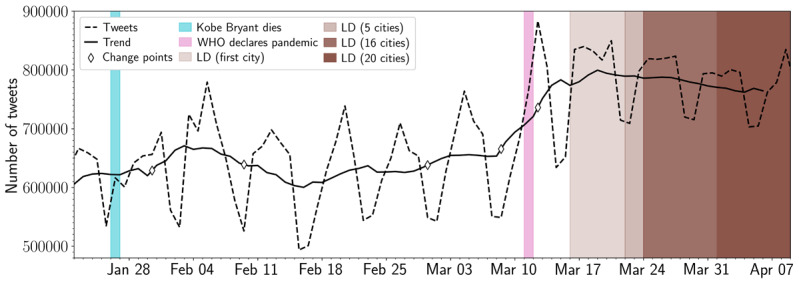
Figure 3.

Number of daily tweets in a subsample of the user timeline data. The dashed line displays the daily number of tweets in the subsample of the user timeline data. The solid line indicates the underlying trend in the daily number of tweets (after removing its seasonal effects). The diamond markers indicate significant change points indicated by the Pruned Exact Linear Time algorithm. The light blue and pink annotations denote the death of Kobe Bryant (January 26, 2020) and the day when the WHO declared COVID-19 a global pandemic (March 11, 2020), respectively. The brown bars indicate the dates that lockdowns were enforced in the 20 considered cities (ranging from March 16 to April 1, 2020). The opacity of the brown bars indicates how many cities had enforced a lockdown at that date. LD: lockdown; WHO: World Health Organization.
