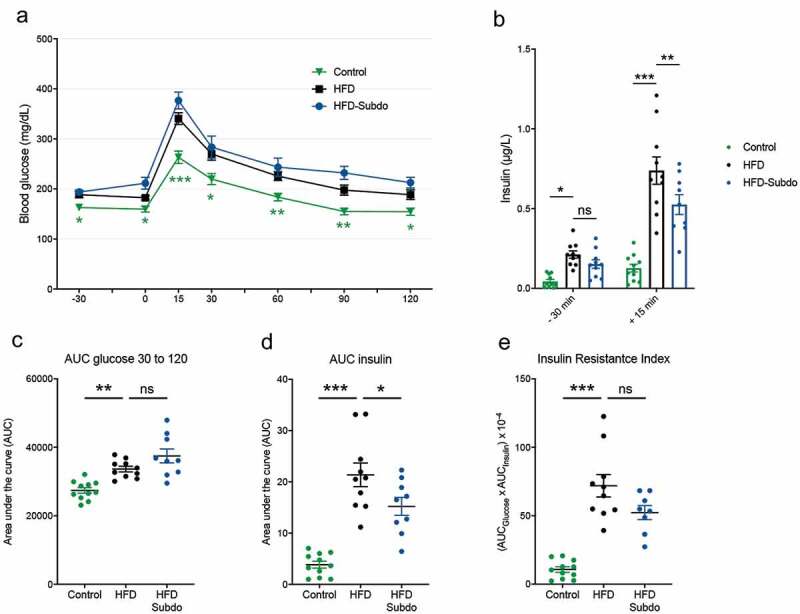
Figure 3.

Subdoligranulum variabile supplementation does not impact on glucose metabolism
(A) Plasma glucose profile measured during an oral glucose tolerance test (OGTT). (B) Plasma insulin measured 30 min before and 15 min after glucose administration during the OGTT. (C) Mean area under the curve (AUC) of glucose measured during (OGTT). (D) Mean area under the curve of plasma insulin measured 30 min before and 15 min after glucose administration. (E) Insulin resistance index, calculated multiplying the area under the curve of both blood glucose (−30 to 120 min) and plasma insulin (−30 and 15 min) obtained following the oral glucose tolerance test. Data are represented as means ± SEM. Data were analyzed using 2-way repeated measures ANOVA for A or one-way ANOVA followed by a Tukey post hoc test for B-E.‘*’ ‘**’ and ‘***’ indicate a significant difference versus HFD (P < .05, P < .01, P < .001, respectively).
