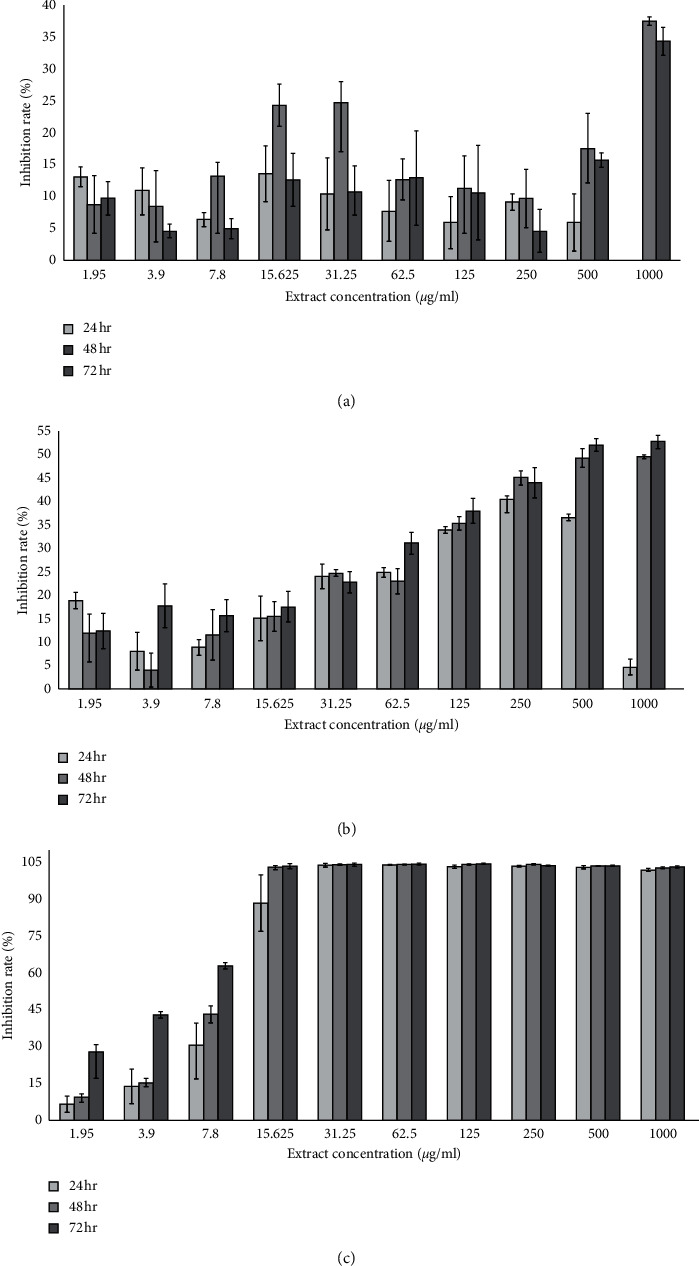
Figure 3.

Cytotoxicity effects on A549 cell lines after 24, 48, and 72 hr measured by MTT. (a) Inhibition rates of A549 cells treated with different concentrations of hot aqueous extract. (b) Inhibition rates of A549 cells treated with different concentrations of cold aqueous extract. (c) Inhibition rate of A549 cells treated with different concentrations of tamoxifen as control.
