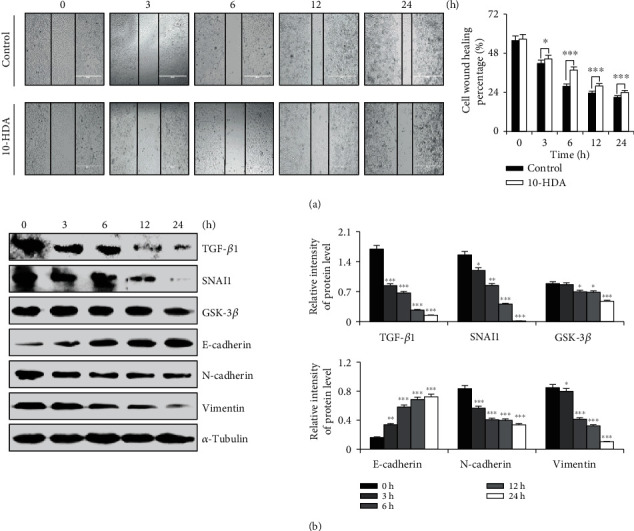
Figure 6.

Effects of cell migration after treatment of human lung cancer cells with 10-HDA. (a) A549 cells were treated 3, 6, 12, and 24 h with 10-HDA, using the EVOS FL Auto Cell Imaging System at a magnification of 100x to observe. (b) A549 cells were treated with 10-HDA for 3, 6, 12, and 24 h to detect the levels of apoptotic proteins (TGF-β1, SNAI1, GSK-3β, E-cadherin, N-cadherin, and vimentin) and were normalized to α-tubulin. The expression levels of proteins were analyzed by ImageJ software. ∗p < 0.05, ∗∗p < 0.01, and ∗∗∗p < 0.001 vs. the control group.
