
Figure 4.
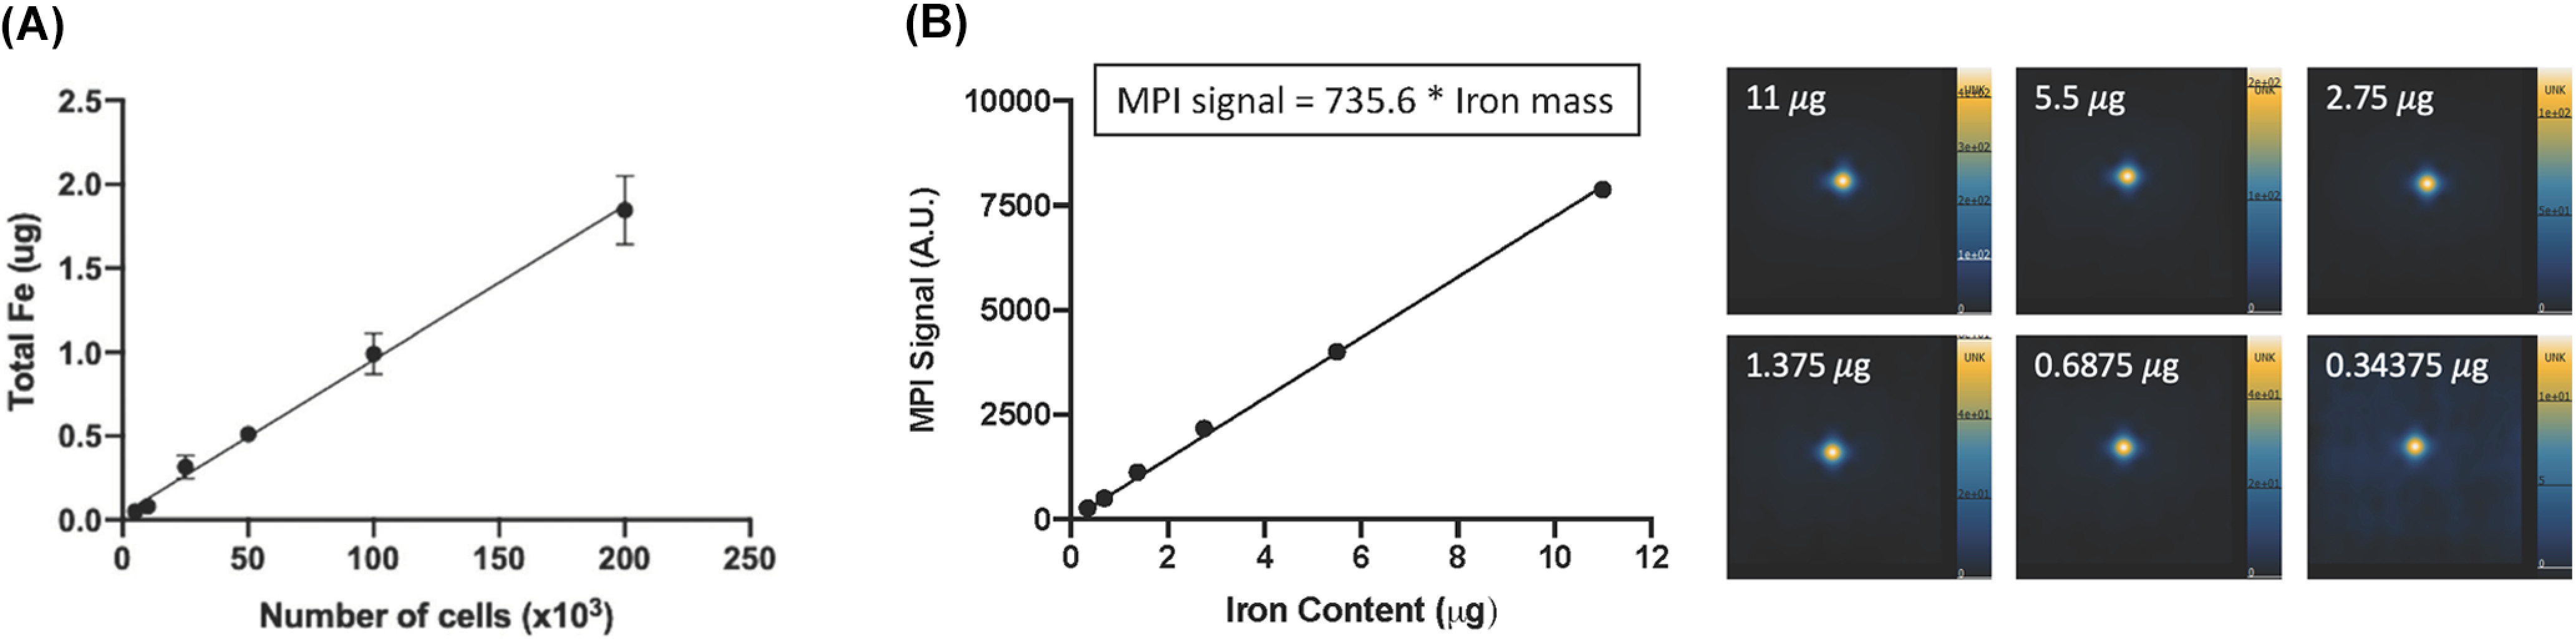
MPI quantification. The iron mass measured from MPI images is directly linear with the number of ferucarbotran-labeled RAW 264.7 macrophages (R2 = 0.9789) (A). Reproduced from Makela et al. (37). MPI signal is directly linear to the amount of iron, as displayed in a calibration line (R2 = 0.9969) (B). This line was produced by imaging multiple samples of ferucarbotran, which varied in iron mass, and the MPI signal from these images was quantified. MPI images are displayed in full-dynamic range in arbitrary units (AU).