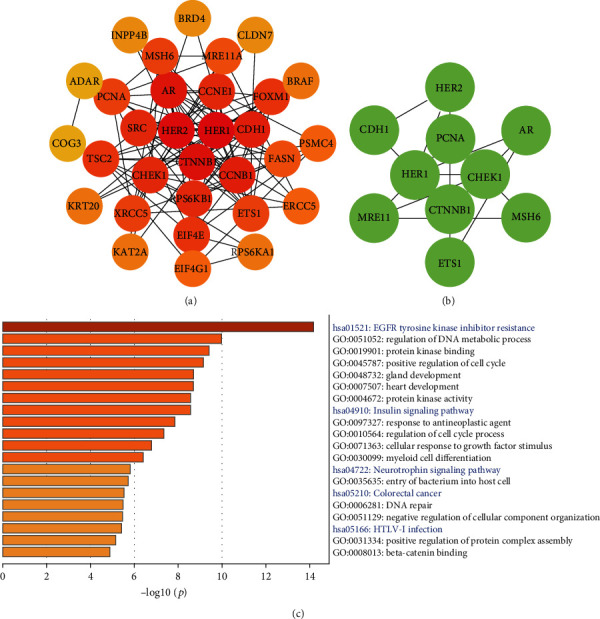
Figure 11.

Protein-protein interaction (PPI) and enrichment analysis among coexpressed 46 proteins. (a) The PPI was ranked by degrees calculated by Cytoscape plugin cytoHubba. The darker the color, the higher the degree. (b) The significant module MOCDE_1 was built using the MCODE plugin at the Metascape. (c) The pathway and process enrichment analysis among 46 proteins. Blue words represented KEGG analysis, while black words represented GO analysis (p < 0.05).
