
Figure 6.
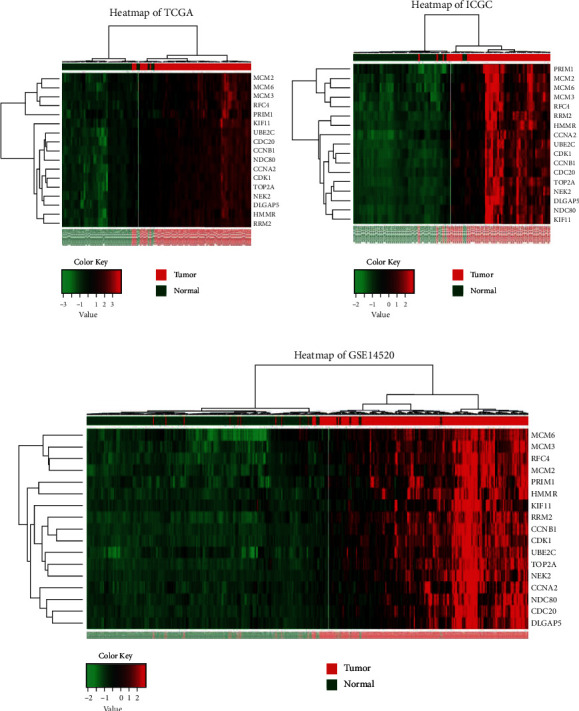
Clustering heatmaps of 17 hub genes based on (a) TCGA-LIHC, (b) ICGC-LIRI-JP, and (c) GSE14520. Red denotes high expression levels while green denotes low expression levels.
Official websites use .gov
A
.gov website belongs to an official
government organization in the United States.
Secure .gov websites use HTTPS
A lock (
) or https:// means you've safely
connected to the .gov website. Share sensitive
information only on official, secure websites.
Clustering heatmaps of 17 hub genes based on (a) TCGA-LIHC, (b) ICGC-LIRI-JP, and (c) GSE14520. Red denotes high expression levels while green denotes low expression levels.