
Figure 9.
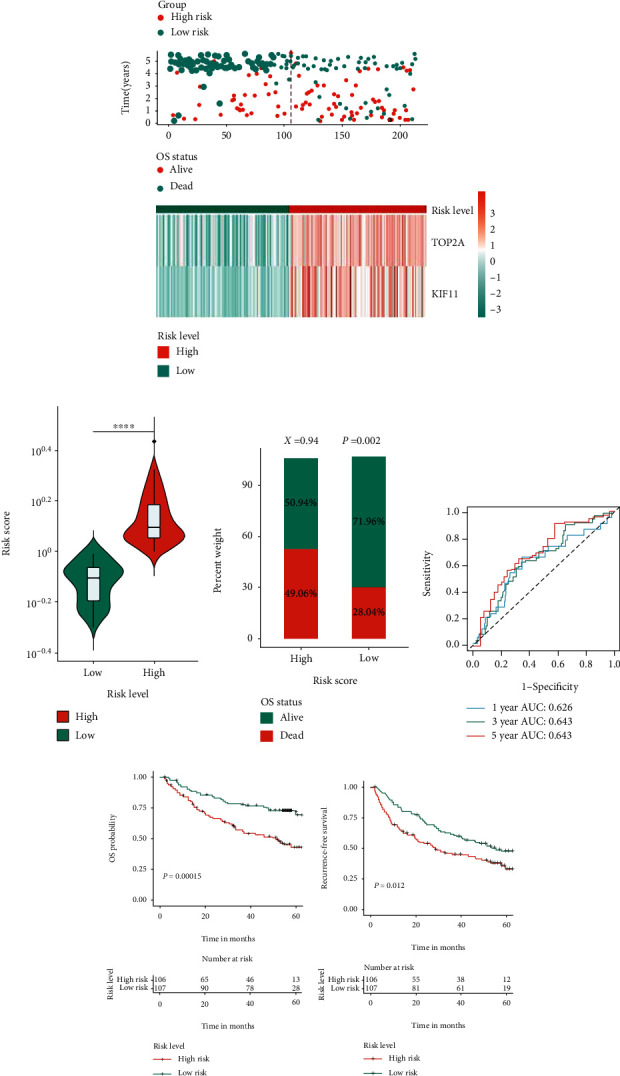
Prognostic assessments of hub genes by GSE14520 cohort. (a) Risk score, survival outcome, and hub gene expression values for each patient in high- and low-risk groups. (b) Comparison of risk scores between high- and low-risk groups. ∗∗∗∗P < 0.0001. (c) Distribute of different survival status in high- and low-risk score groups. Statistical significance was determined by chi-square test. (d) The time-dependent ROC curves for the two-hub gene-based signature at 1, 3, and 5 years to assess accuracy of prognostic prediction. (e, f) Kaplan-Meier curves of (e) OS and (f) RFS in HBV-HCC patients based on the risk score classification. P was calculated by the log-rank test, and P < 0.05 was considered statistically significant. HBV-HCC: HBV-related HCC; OS: overall survival; RFS: relapse-free survival.