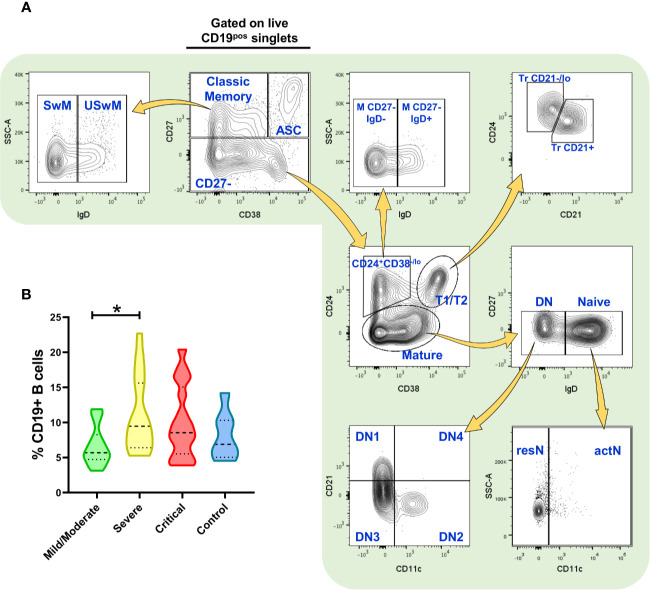
Figure 1.
Flow cytometry analysis of B cell subsets and frequency of total (CD19+) B cells. (A) Gating strategy for the identification of the indicated B cell subsets in peripheral blood mononuclear cells (PBMCs) (depicting representative results from a healthy control) previously selected from singlets gate (SSC-A vs. SSC-H) and live Zombie Green- cells. (B) Frequency of total CD19+ B cells in PBMCs from patients infected with SARS-CoV-2 (n=52) and healthy controls (n=7, negative PCR for SARS-CoV-2). Frequency values are displayed as mean (dashed line) plus lower and upper quartiles (dotted lines). The data were analyzed by a Kruskal-Wallis test followed by a Dunn’s post-hoc test. *p < 0.01. This figure was made using arrows from Servier Medical Art (http://smart.servier.com/), licensed under a Creative Commons Attribution 3.0 Unported License (https://creativecommons.org/licenses/by/3.0/).

