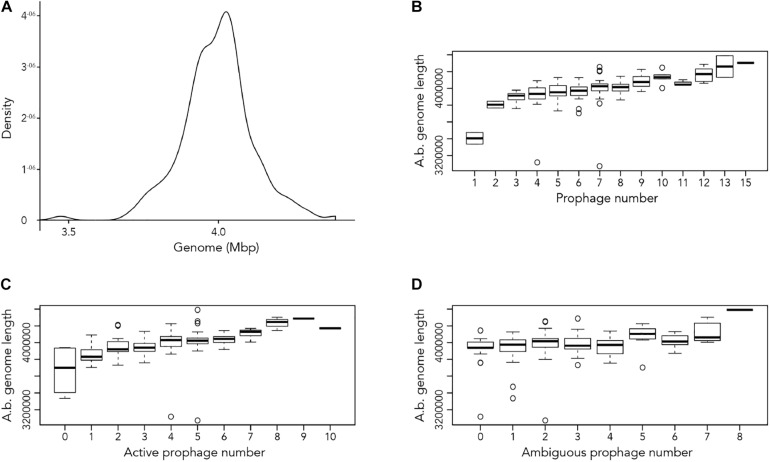
FIGURE 1.
Length of A. baumannii genomes and its correlation with number of prophages present. (A) Density graph of 177 genome sequences of A. baumannii strains, indicating the distribution of the lengths of genome sequences analyzed. (B–D) Correlation between A. baumannii genome length and number of (B) all prophages, (C) active prophages, and (D) ambiguous prophages identified in genomes.

