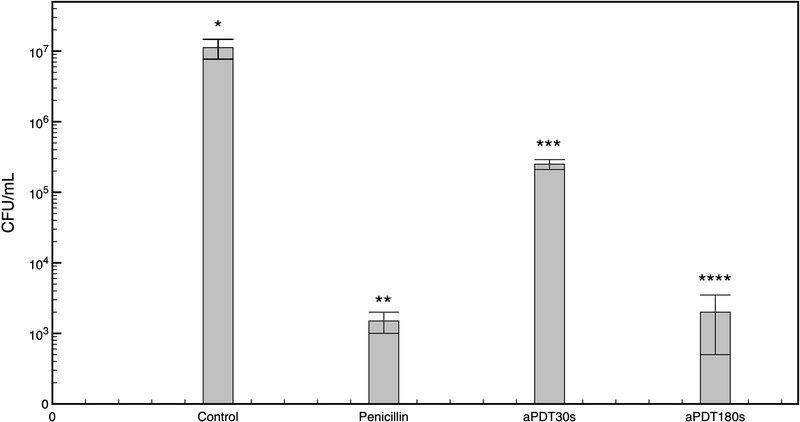
Figure 1:
Mean and standard deviation of viable bacteria (CFU) after each treatment. Asterisks indicate differences between groups (p < 0.05). Note that light alone or MB alone did not show significative bacterial reduction. Also, lethal dose of aPDT showed similar results than antibiotic treatment.

