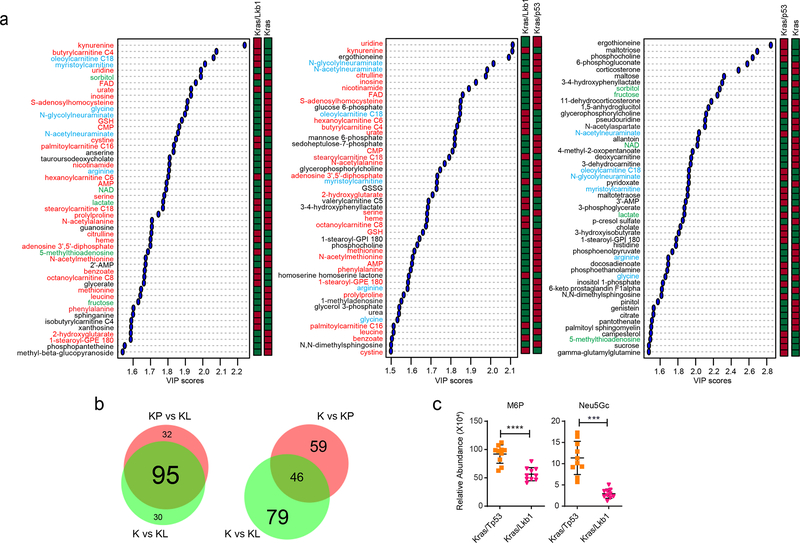
Extended Data Fig. 3. Lkb1, but not p53, mutation significantly alters metabolism of Kras mutant mouse lung tumor.
a, Key metabolites differentiating between Kras (K) and Kras/Lkb1 (KL) tumors (left), Kras/Lkb1 (KL) and Kras/p53 (KP) tumors (middle) and Kras (K) and Kras/p53 (KP) tumors (right) (VIP>~ 1.5). Metabolites shown in all three groups are in light blue whereas ones only shown in the first and second group are in red and ones only shown in the first and third group are in green. Relative metabolite abundance is indicated in the bar, with red representing metabolite accumulation. b, Venn diagrams of Variable Importance in the Projection metabolites (VIP>1.0) between [K and KL tumor tissues] and [KP and KL tumor tissues] (left) and between [K and KP tumor tissues] and [K and KL tumor tissues]. c, Abundance of M6P and N-glycolylneuraminic acid (Neu5GC) from the metabolomics in Extended Data Fig. 3a. Individual data points are shown with mean values and SD for ten (KP) or ten (KL) mouse tumors. M6P, mannose-6-phosphate; Neu5Gc, N-glycolylneuraminic acid. Statistical significance was assessed using Wilcoxon signed rank test. *p<0.05; **p<0.01.

