
Fig. 7.
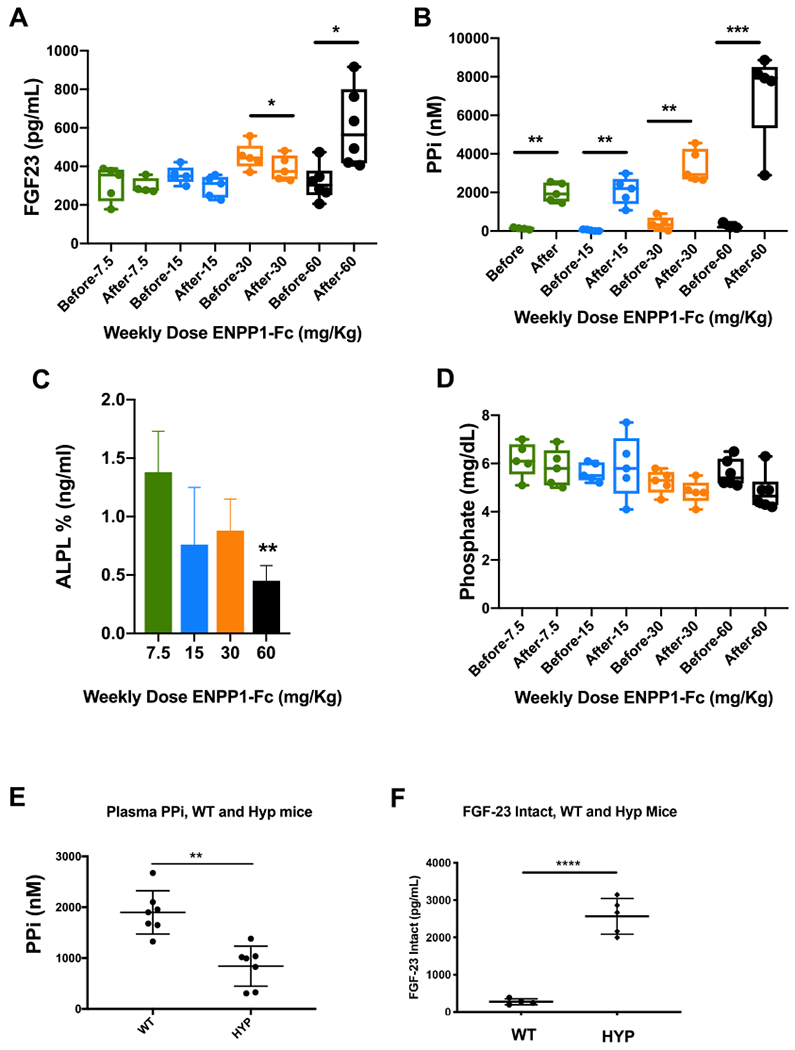
Response of intact FGF23, alkaline phosphatase, and plasma PPi and Pi to ENPP1 (A–D). Enpp1asj/asj mice were dosed with increasing concentrations of soluble ENPP1, and the listed analytes were quantified before and after 2 weeks of dosing. ALP levels are expressed as fractional changes compared to predosed animals. (E) Plasma PPi and (F) intact FGF23 in sibling pairs of WT and Hyp mice. *p < 0.05; **p < 0.01; ***p < 0.001; ****p < 0.0001 Student’s paired (A–D) and unpaired (E–F) t-test.