
Figure 3:
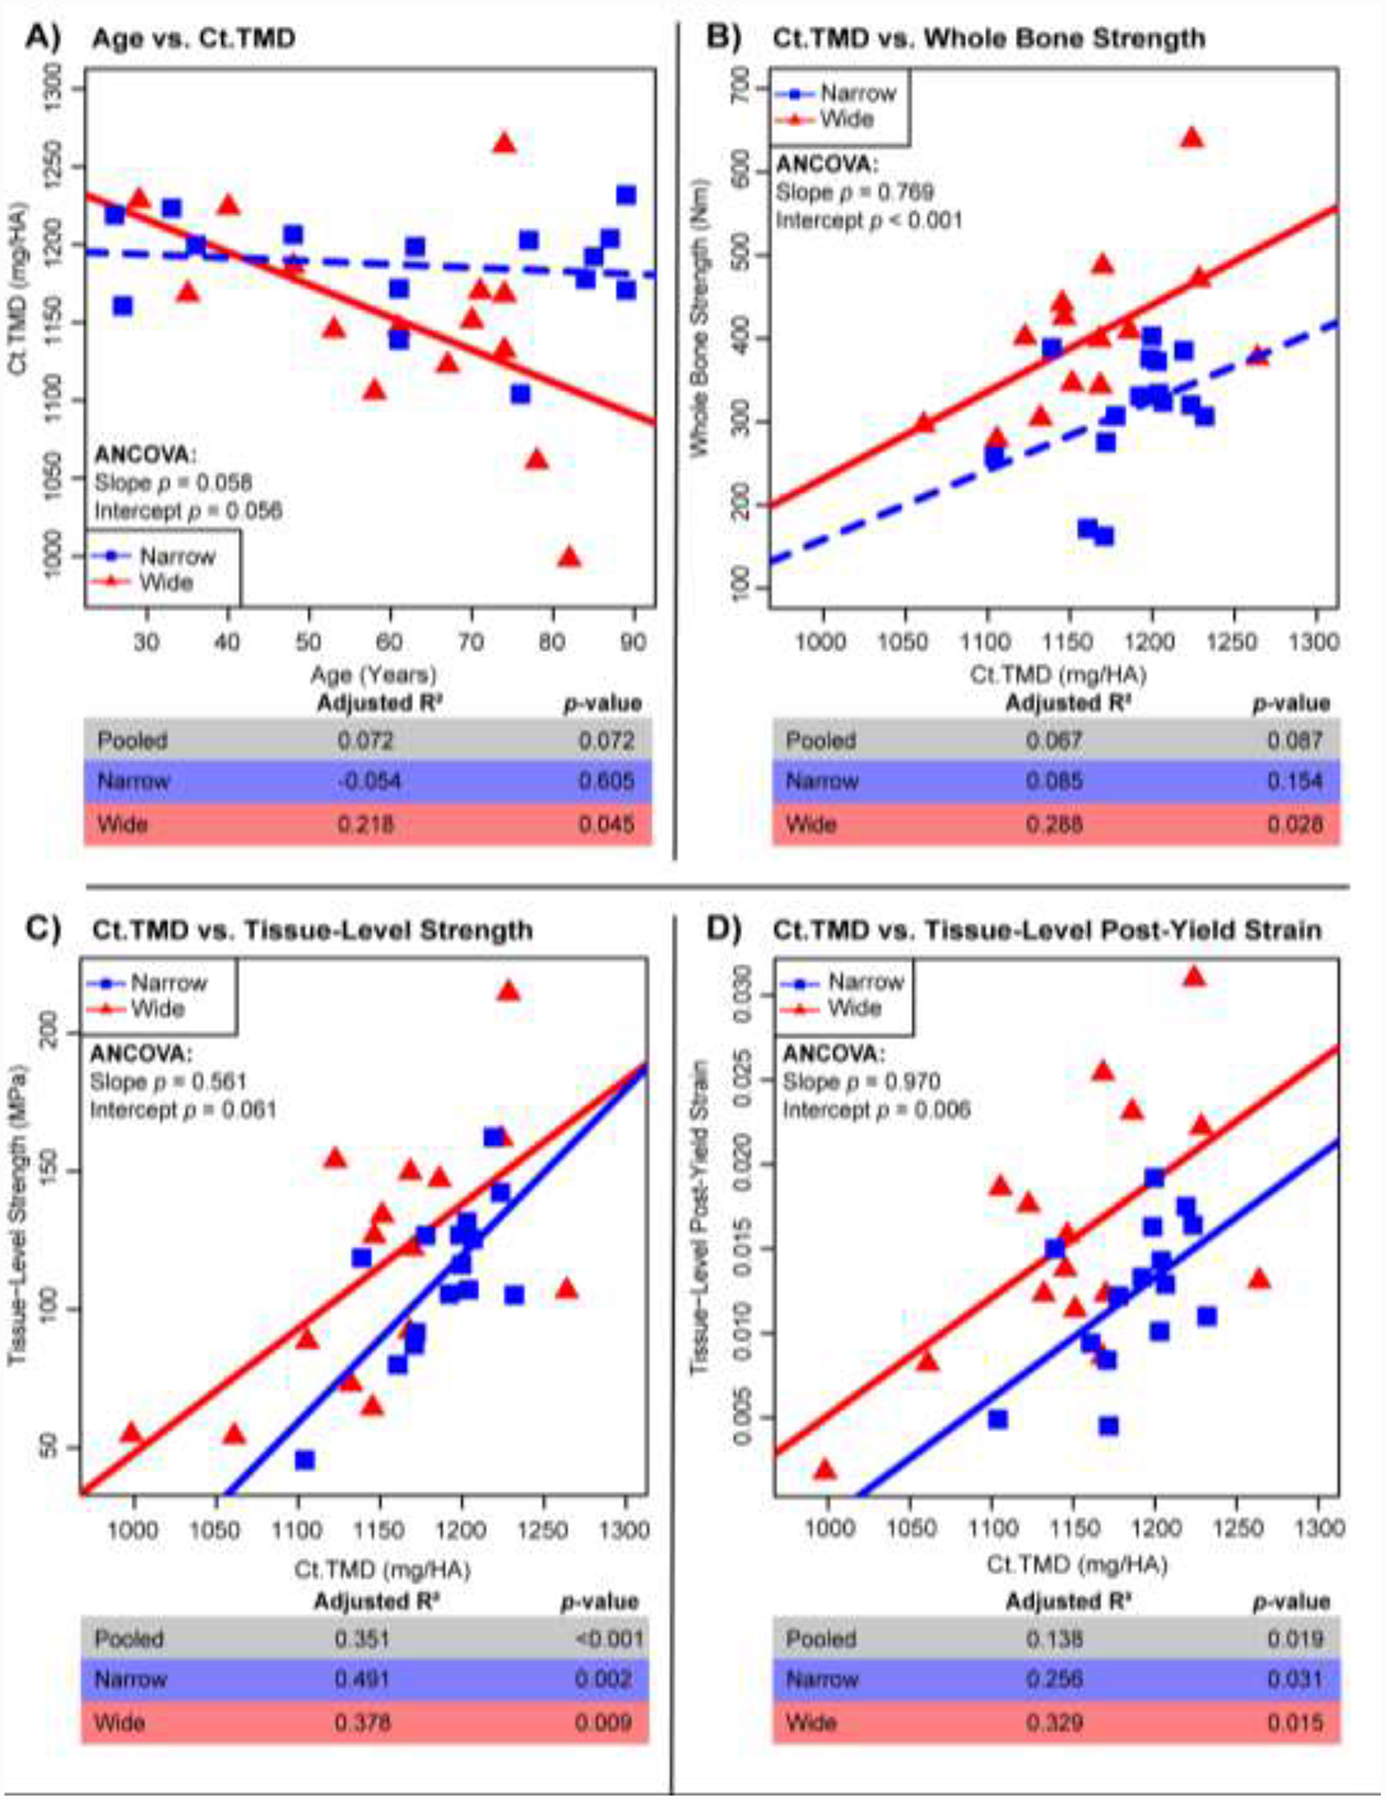
Regressions for Ct.TMD vs. age (A) and mechanical properties of whole bone strength (B), tissue-level strength (C) and tissue-level post-yield strain (D). Adj. R2, and p-values are shown for pooled samples (n=33), the wide group (n=15), and the narrow group (n=15). Solid lines represent a significant regression (p-value < 0.05) and dashed lines represent a non-significant regression.