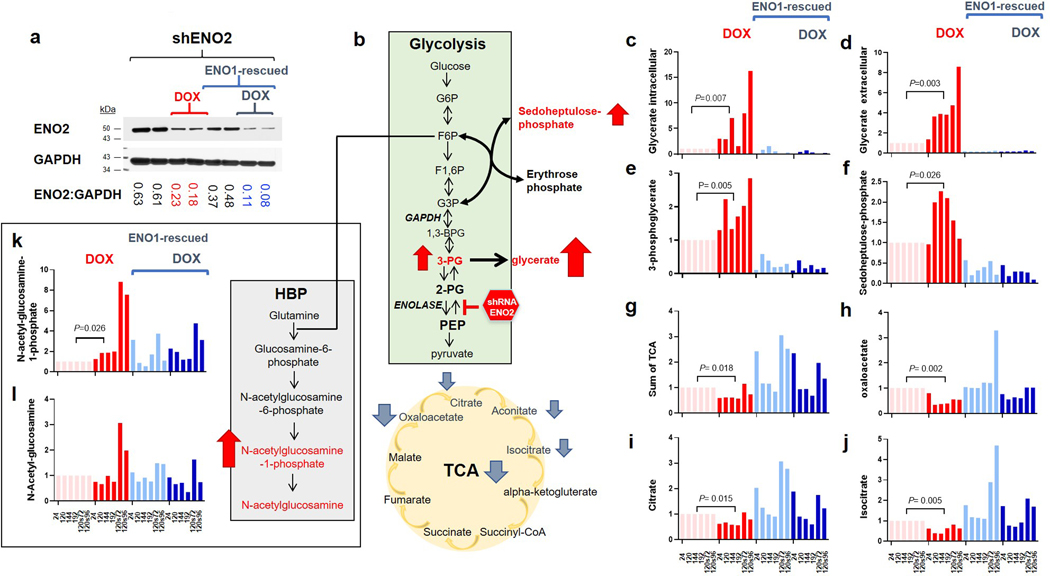
Extended Data Fig. 9. ShRNA knockdown of ENO2 recapitulates metabolic disruptions caused by small-molecule ENO2 inhibitors.
a. Knockdown of ENO2 by doxycycline-inducible shRNA in D423 ENO1-deleted and ENO1-rescued cells with the same constructs and cell lines used previously3. Induction of shENO2 results in ~70% decrease in ENO2-protein levels (ratios of band densities ENO2 to TPI, loading control, are indicated). The western blot analysis was performed once with each line representing a single biological replicate. Polar metabolites were profiled at specific times after induction of shENO2 with doxycycline (times indicated in x-axis, hours) in both conditioned media (extracellular) and cell pellet (intracellular), with cells passaged after 120 h. b. Schematic showing the Enolase reaction in the context of central carbon metabolism and associated pathways, with metabolites altered selectively in D423 ENO1-deleted cells in response to ENO2-knockdown. c-e. Accumulation of metabolites upstream of Enolase in response to ENO2-knockdown in ENO1-deleted but not ENO1-rescued cells recapitulates observation with Enolase inhibitors (Figure 4). Glycerate (c, d) was the most significantly altered metabolite in polar metabolomic profile of conditioned media in ENO1-deleted but not rescued cells. Intracellular glycerate levels (c) recapitulate this trend and mirror the levels of 3-PG(e), from which it is hydrolyzed. f-j. TCA-cycle metabolites were selectively decreased in response to ENO2-knockdown, recapitulating effects of small molecule Enolase inhibition (Figure 4). Similar to observations with small molecule Enolase inhibition, hexosamine biosynthesis pathway (HBP) metabolites increase in response to ENO2 knockdown. k-l. Each bar represents one biological replicate. P values from T-test of the log of the normalized values of each biological replicate are indicated.

