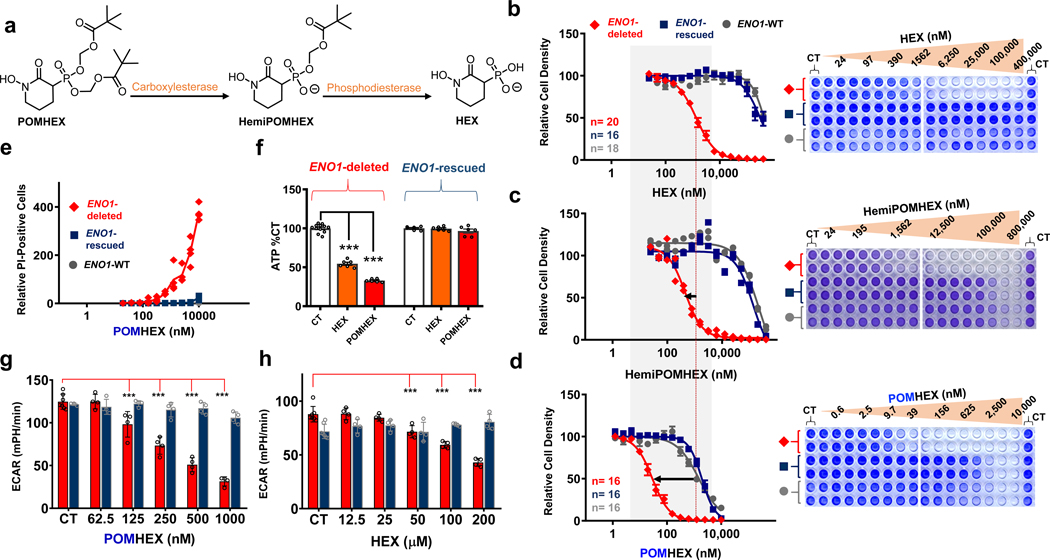
Figure 2. POMHEX is a potent pro-drug inhibitor of ENO2.
a. Proposed mechanism of bioactivation. Hydrolysis of the first POM group occurs through carboxylesterases while hydrolysis of the second POM group occurs through phosphodiesterases. b-d. POM groups improve the cellular permeability of HEX as indicated by left-shift in IC50s for HemiPOMHEX and POMHEX. POMHEX is > 40-fold more potent than the non-pro-drug HEX (b versus d). Selective action against ENO1-deleted cells (D423, red) over ENO1-isogenically rescued (D423 ENO1, blue), and ENO1-WT (LN319, grey) cells is maintained. Number of independent experiments (n) is indicated in b and d for each cell line, mean ±SEM are shown. e. POMHEX selectively induces cell death against ENO1-deleted cells. Each data point represents a single biological replicate (n=4 experiments) of propidium iodide-positive cells relative to CT in ENO1-deleted (D423, red), ENO1-isogenically rescued (D423 ENO1, blue), and ENO1-WT (LN319, grey) cells. f. D423 ENO1-null and D423 ENO1-rescued glioma cells were treated with HEX (orange bars, 200 μM) and POMHEX (red bars, 78 nM). Cells were treated for 8 hours and ATP was measured with the cell titer glow assay. Individual data points and the mean ± S.E.M. of n = 12, 6 (CT) and n = 6 (HEX, POMHEX) biological replicates are shown. Significant differences are indicated, using 1-way ANOVA with Tukey’s Multiple Comparison Test. ***P<0.001. g,h: The effect of HEX and POMHEX on glycolytic flux was quantified by extracellular acidification rates (ECAR) in ENO1-null (D423, red bars) and isogenic ENO1-rescued cells (D423 ENO1, blue bars). Individual data points and the mean ± S.D. of n = 7 (CT) but n=3 for ENO1-rescued cells (CT) in g and n= 4 (HEX, POMHEX treated) biological replicates are shown. Significant differences are indicated, ***P<0.001 ANOVA with Tukey’s Multiple Comparison Test.

