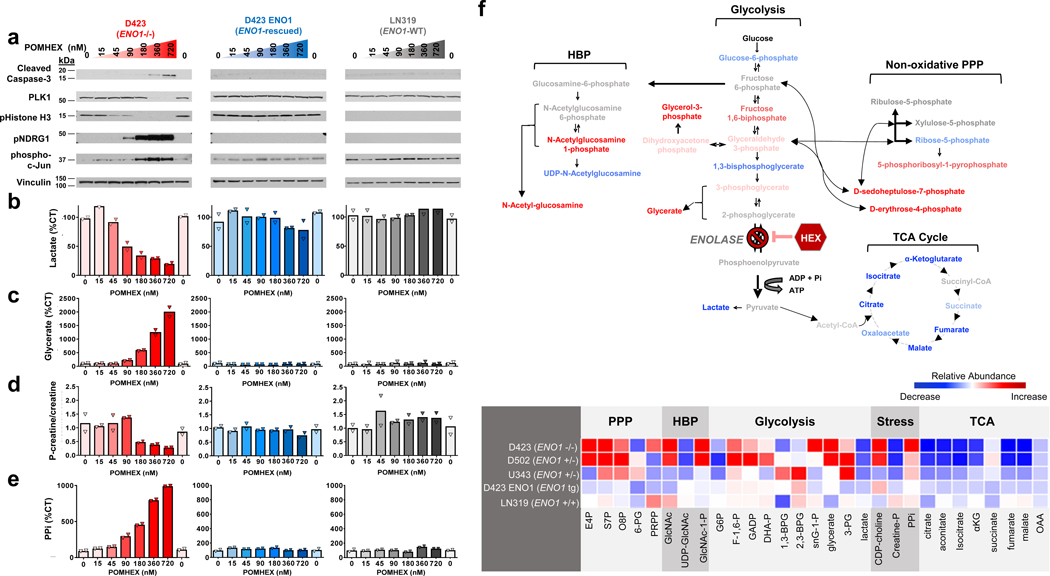
Figure 3. POMHEX selectively induces energy stress, inhibits proliferation, and triggers apoptosis in ENO1-deleted glioma cells.
ENO1-deleted (D423, red), ENO1-isogenically rescued (D423 ENO1, blue), and ENO1-WT (LN319, grey) glioma cells were treated with the Enolase inhibitor POMHEX for 72 hours. Cells were harvested for protein lysates and polar metabolites. a. ENO1-deleted cells experience dose-dependent increase in stress response markers (phosphorylated T346 NDRG1, S73 c-Jun), decrease in proliferation (phosphorylated Histone H3, PLK1), and increase in cell death (cleaved caspsase-3), as indicated by western blot. Such effects are exclusive to ENO1-deleted cells (left, red) and are absent in ENO1-WT cells (middle, blue; right, grey). b. Lactate levels were measured by 1H NMR with the integral of 1.34 ppm doublet normalized to 3-(trimethylsilyl)propionic-2,2,3,3-d4 acid standard and expressed as % of CT [(n=2(CT), mean of n=1 (treated biological replicates)]. A dose-dependent decrease in lactate levels is unique to ENO1-deleted, but not ENO1-WT, glioma cells. c. Glycerate levels were used as a marker of Enolase inhibition and were measured by mass spectrometry. Values are expressed as % of CT [(n = 4(CT), mean of n = 2 (treated biological replicates)]. A dose-dependent increase in glycerate levels was observed in ENO1-deleted but not ENO1-WT glioma cells. d-e. Phosphocreatine/creatine ratio and pyrophosphate (PPi) levels quantified via mass spectrometry were used as measures of energy stress. The dose-dependent decrease in phosphocreatine to creatine ratio (d) and increase in PPi (e) in response to POMHEX treatment is specific to ENO1-deleted glioma cells. Both measurements are expressed as a % of CT [N = 4(CT), mean of N = 2 (treated biological replicates)]. f. Treatment with POMHEX results in depletion of anaplerotic substrates. Top: metabolic map showing relative increases (red) and decreases (blue) of relevant metabolites in glycolysis, hexosamine biosynthesis pathway, non-oxidative pentose phosphate pathway, and TCA cycle in ENO1-deleted (D423) cells. Bottom: heat map of relevant metabolites in ENO1-deleted (D423), ENO1-heterozygous deleted (D502, U343), and ENO1-WT (LN319) glioma cells. A decrease in TCA metabolites is observed across all cell lines treated with POMHEX, Relative abundance is expressed as area-under-the-curve calculations of metabolite levels obtained from dose-response POMHEX treatment.

