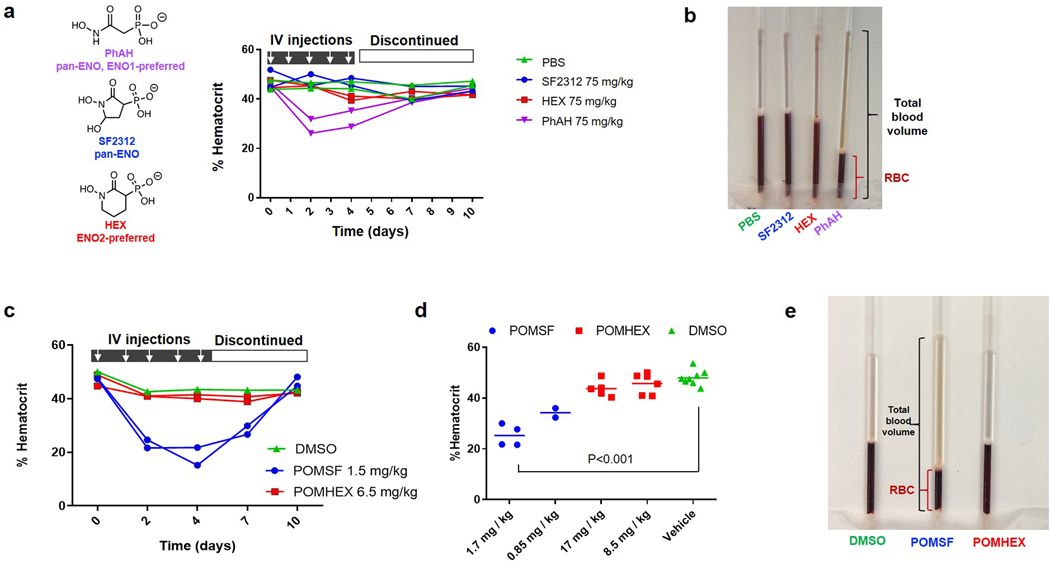
Extended Data Fig. 1. Rapid induction of anemia by non-ENO2-specific Enolase inhibitors.
a. Non pro-drugged phosphonate Enolase inhibitors were administered to mice by tail vein IV injection at the times indicated (white arrows) to determine effects on hematocrit (fraction of RBC / total plasma volume). Each trace represents an individual mouse treated and sampled repeatedly over 10 days, with two animals per drug or vehicle (green). Phosphoacetohydroxamate (PhAH; purple) caused a rapid and significant drop in hematocrit (and visible jaundice), which is then restored to initial levels after discontinuing treatment. PhAH is a pan-Enolase inhibitor with slightly greater potency against ENO1 over ENO2. As ENO1 is the sole isoform expressed in RBCs, anemia caused by PhAH is most likely due to on-target inhibitory activity against ENO1. b. Representative capillary tube after centrifugation from the hematocrit experiment described in a. The ratio of RBC fraction to total blood volume is decreased in response to PhAH treatment; pale yellow plasma in the PhAH sample indicates hemolysis. c,d. POMSF is a POM-pro-drug version of SF2312 that was generated for in vivo testing. Mice were IV tail vein injected with either vehicle (DMSO), POMSF, or POMHEX dissolved in PBS at the indicated doses. Capillary tubes were used to measure percent hematocrit. c. Hematocrit was determined as a function of time in response to Enolase inhibitors over a 10-day treatment course. Mice were administered either DMSO (green), POMSF (blue), or POMHEX (red) for 5 days before discontinuing treatment. Compared to the DMSO control and POMHEX, administration of POMSF results in decreased percent hematocrit, which is then restored to initial levels after discontinuing treatment. Significant differences by non-paired t-test with Bonferroni correction are indicated in d. e. Representative capillary tubes from mice treated with DMSO vehicle (left), POMSF (middle), and POMHEX (right). Note the decrease hematocrit (red bracket) as fraction of total blood volume (black bracket) from POMSF treatment; pale orange plasma indicates hemolysis

