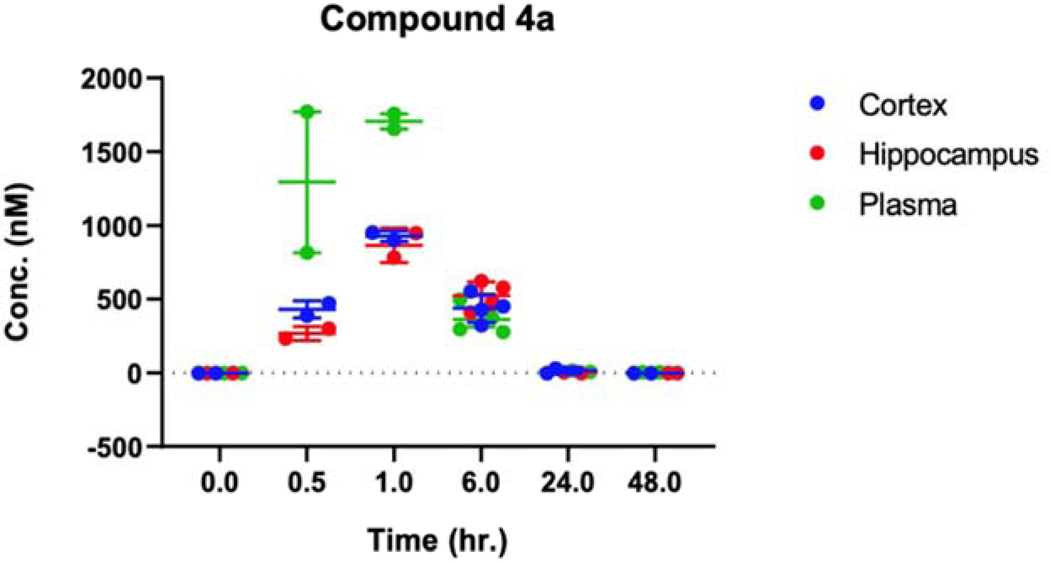
Figure 3.
Distribution of 4a in plasma and brain. Concentration (nM) of compound 4a in plasma and brain at 0, 0.5, 1, 6, 24, and 48 hours after single i.p. administration (10 mg/kg) was measured by liquid chromatography-tandem mass spectrometry. Data are expressed as the mean ± SEM of 2–4 independent experiments.

