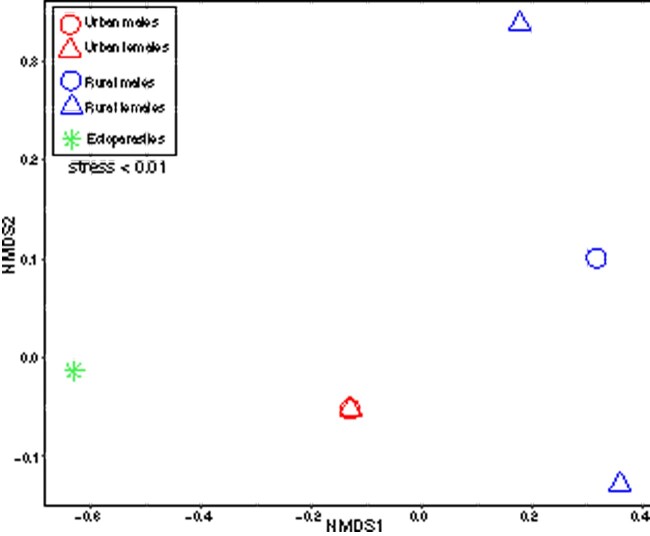
Figure 3.
nMDS ordination showing differences in virome composition (at the family level) among samples according to habitat and sex. Individual points represent individual pooled samples. Points closer together have a more similar virome composition (based on Bray–Curtis dissimilarity, which incorporates both the diversity and abundance of viruses) and vice versa for those further apart. The stress value was <0.01 and is indicated on the figure.

