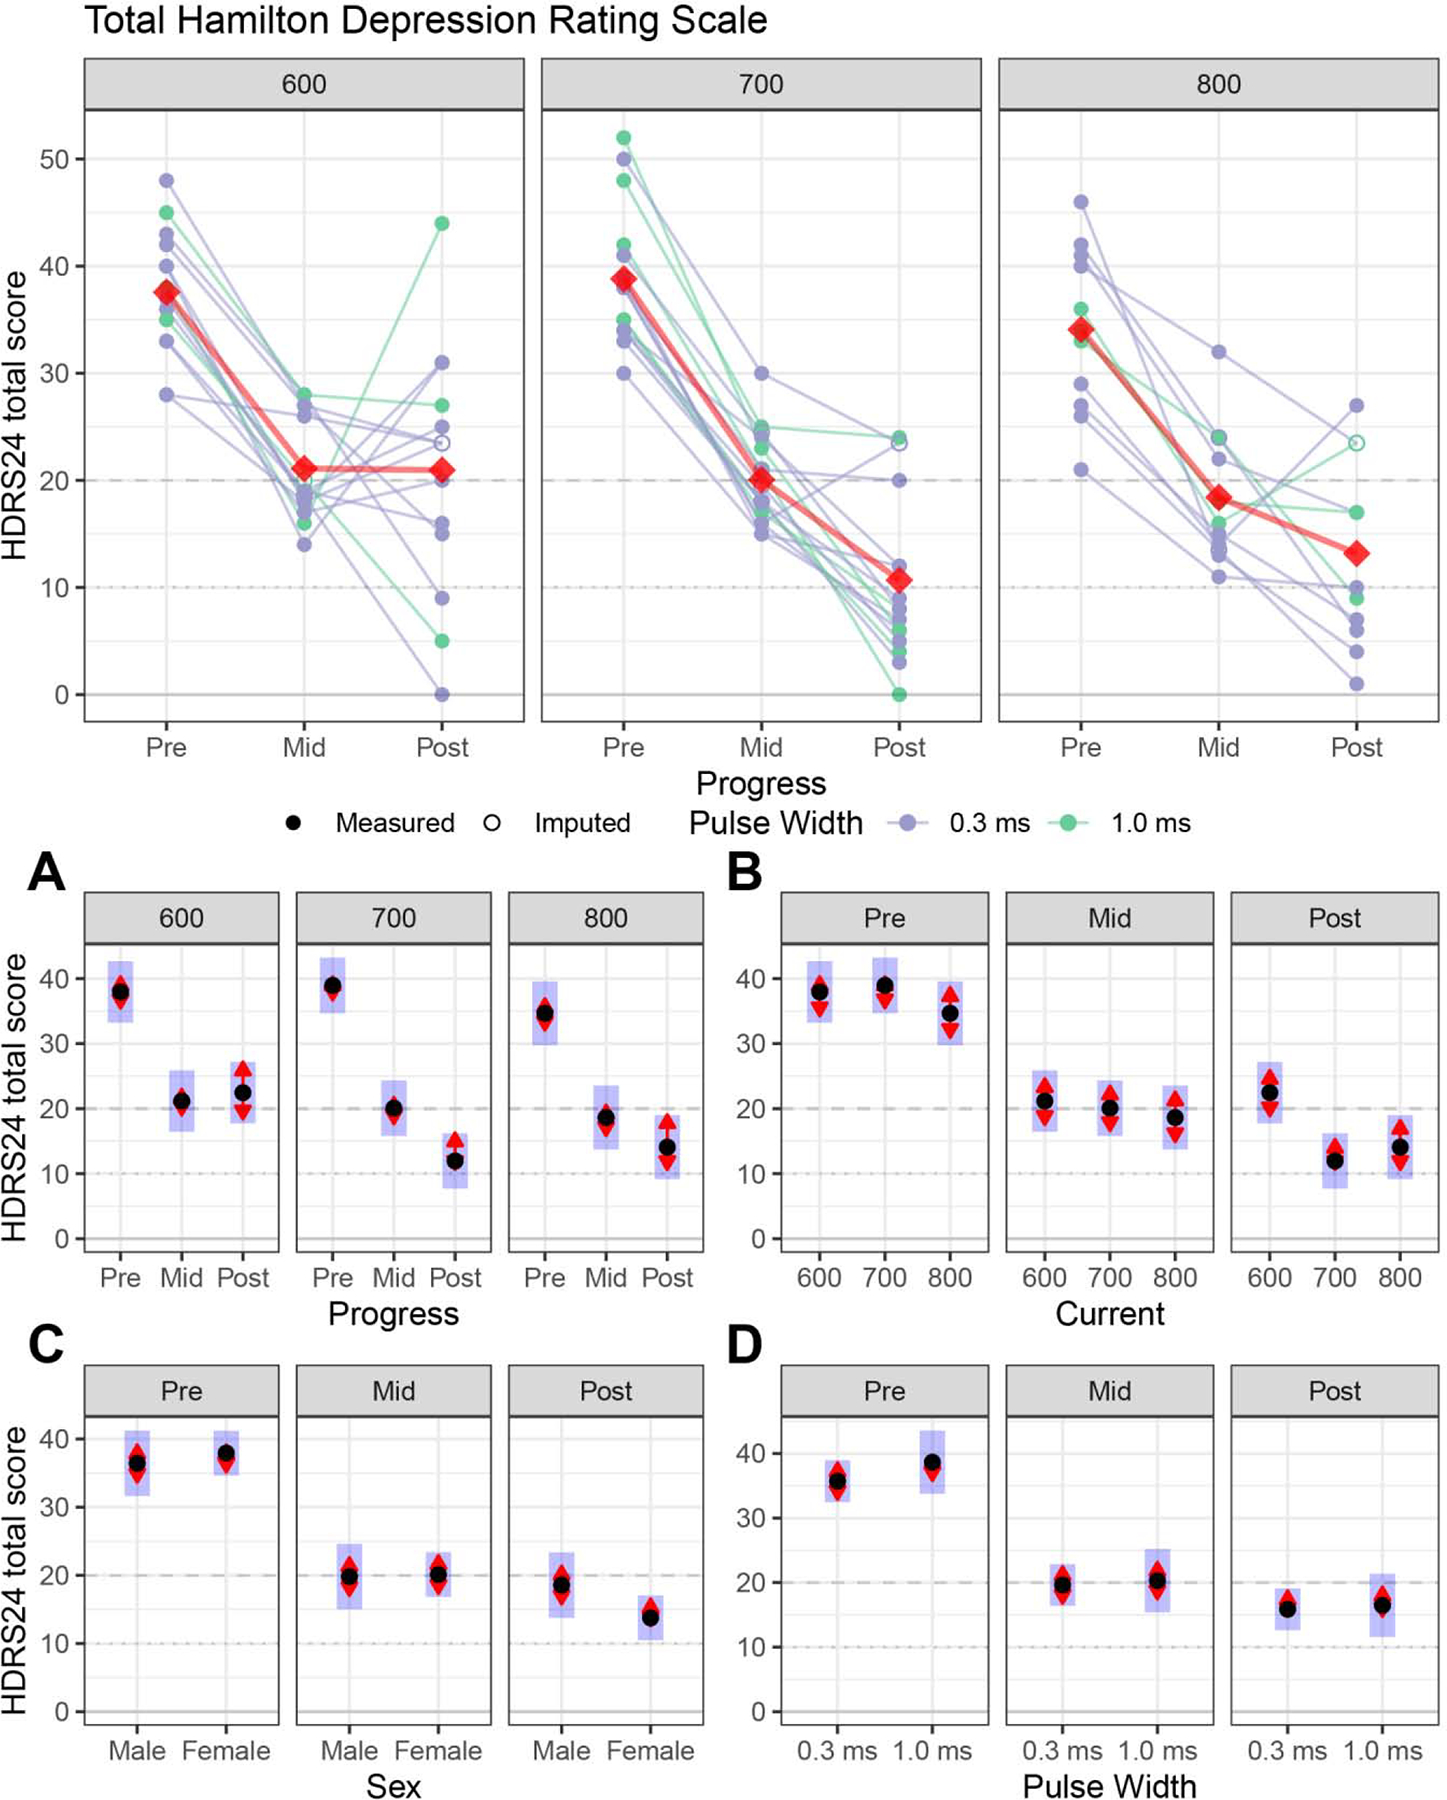
Figure 2:

Primary antidepressant outcome (Hamilton Depression Rating Scale 24-items, HDRS24) for right unilateral electrode placement. For the Figures A, B, C and D: The black dots are estimated marginal means, the blue bars are 95% confidence intervals, and the red arrows are for the comparisons between means; if the red “comparison arrow” from one mean does not overlap an arrow from another group, the difference is significant at a Tukey-HSD corrected significance level.
Figure 2A: Longitudinal changes within each amplitude. The 600, 700 and 800 mA arms had early improvement, but the 600 mA arm had a response plateau after the mid-ECT assessment.
Figure 2B: Amplitude contrasts at each assessment. Relative to the 600 mA arm, the 700 and 800 mA arms had lower (improved) post-ECT depression ratings.
Figure 2C: Sex differences. Male and female subjects did not have differences in depression outcome.
Figure 2D: Pulse width differences. Brief (1.0) and ultrabrief (0.3) pulse widths did not have differences in depression outcome.
