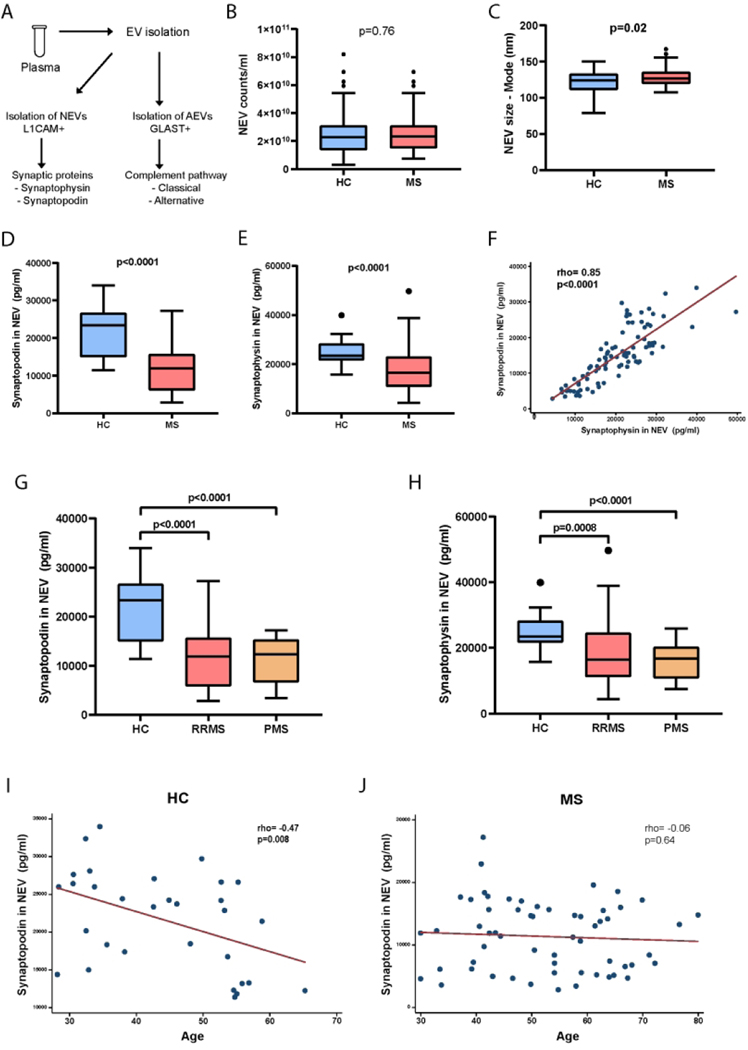
Figure 1. Synaptic proteins in NEVs are reduced in MS.
(A) Schematic representation of the study involving 60 MS patients (45 with RRMS, 15 with PMS) and 31 HC. (B) Concentration of NEVs in MS patient and HC plasma. (C) Average diameter (size) of NEVs in MS and HC groups. (D) NEV Synaptopodin and (E) Synaptophysin concentrations in MS and HC groups. (F) Tight correlation of nEV synaptopodin and synaptophysin concentrations in MS and HC groups. (G) NEV synaptopodin and (H) synaptophysin concentrations in HC, RRMS and PMS groups. (I) Scatter plot of NEV synaptopodin concentration by age in the HC group. (J) Scatter plot of nEV synaptopodin concentration by age in the MS group. p values for B, C, D & E are derived from Student’s t tests. p values for G & H are derived from one-way ANOVA with Dunnett’s multiple comparisons test. rho and p values for F, I & J are derived from Spearman’s correlation.

