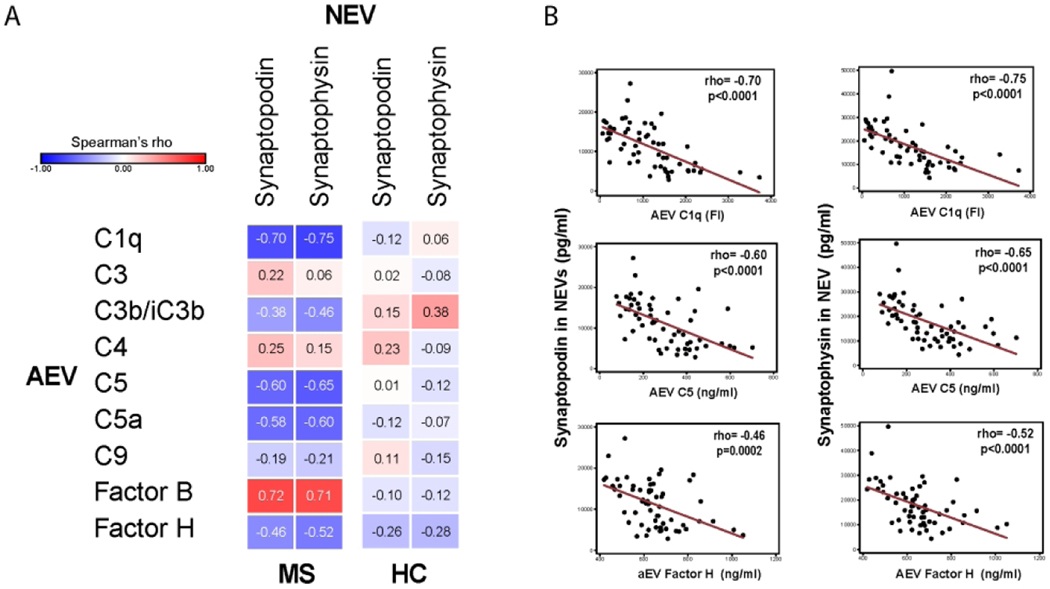
Figure 4. Complement component levels in AEVs are strongly correlated with NEV synaptic protein levels.
(A) Heat map of correlations between NEV synaptic proteins and AEV complement components in MS and HC groups demonstrates strong correlations in MS but not in HC. (B) Scatter plots depicting correlation between selected AEV complement components (C1q, C5, Factor H) and NEV synaptopodin (left) or synaptophysin (right). Rho and p values for J & K are derived from Spearman’s correlations.

