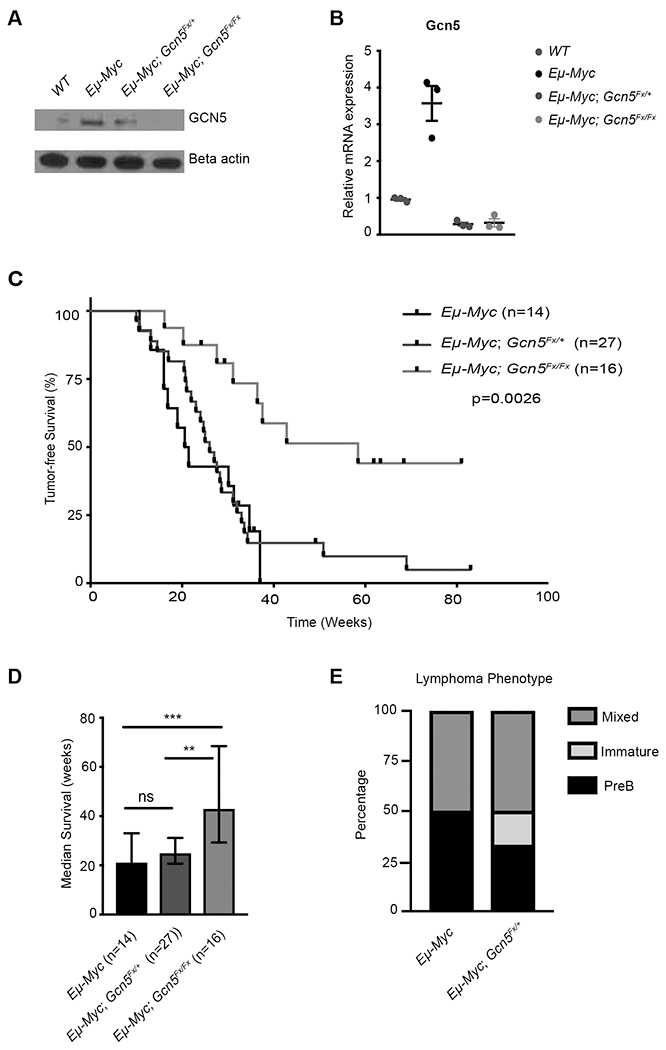
Figure 2. Gcn5 Loss Delays Formation of B Cell Lymphoma in Mouse Model.

A. Representative immunoblot showing increased expression of Gcn5 in CD19+ B cells of Eμ-Myc transgenic mice. B. Relative Gcn5 mRNA expression in CD19+ B cells of WT, Eμ-Myc, Eμ-Myc; Gcn5Fx/+, and Eμ-Myc; Gcn5Fx/Fx mice. (n=3). All p-values determined by unpaired Student’s t-test. Significant P-value was <0.05 C. Kaplan-Meier curve showing tumor-free survival comparing CD19-Cre0/0; Eμ-Myc; Gcn5Fx/+ (n=14), Eμ-Myc; Gcn5Fx/++ mice (n=27) and Eμ-Myc; Gcn5Fx/Fx (n=16) mice. p=0.0026 determine by Log rank test (χ2= 8.406). Log rank (Mantel-Cox) p= 0.0014 (χ2=11.88), Gehan-Breslow-Wilcoxon test p= 0.0023 (χ2=10.31) D. Median survival time of Eμ-Myc, Eμ-Myc; Gcn5Fx/+ mice and Eμ-Myc; Gcn5Fx/Fx mice. p-values determined by one-way ANOVA *p≤ 0.05;**p≤ 0.01; ***p≤ 0.001; ****p≤ 0.0001. E. Quantification of immune phenotypes of tumors from Eμ-Myc and Eμ-Myc; Gcn5Fx/+ mice.
