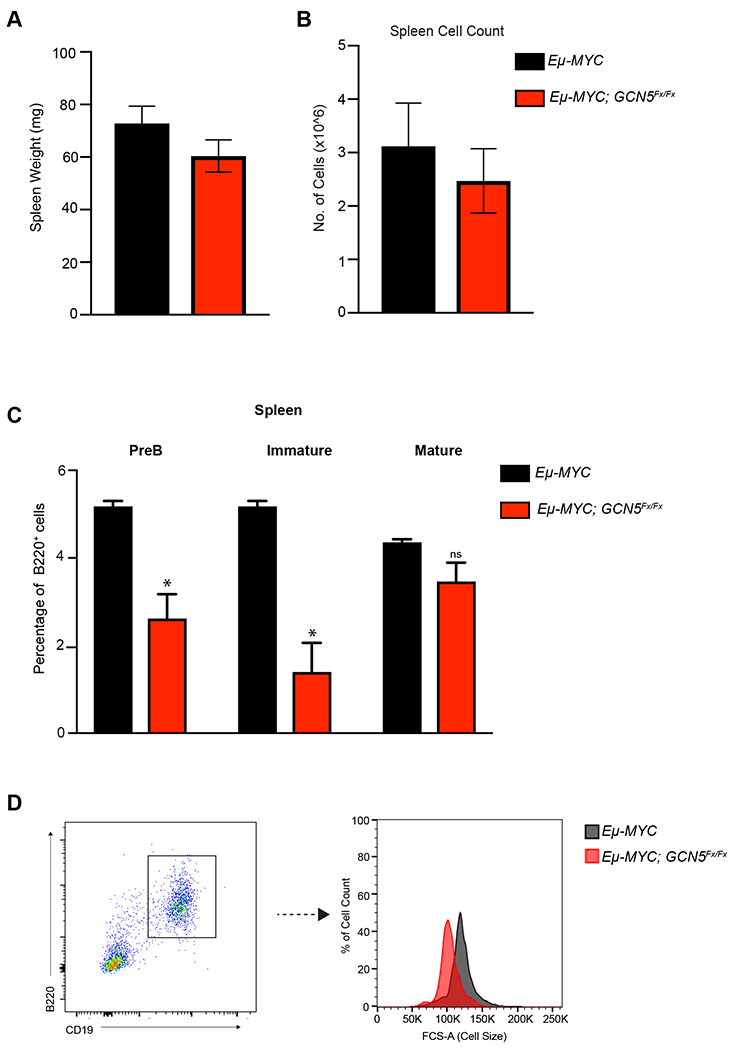
Figure 3. Pre-lymphomic Eμ-Myc mice have altered B cell populations with loss of Gcn5.

A. Spleen weights of 5-6-week-old Eμ-Myc and Eμ-Myc; Gcn5Fx/Fx mice (n=4). B. Total cellularity of spleen of Eμ-Myc and Eμ-Myc; Gcn5Fx/Fx mice (n=4). C. Quantification of flow cytometric analysis of B220+ spleen PreB (PI−B220+CD43loIgM−) cells, Immature (PI−B220+CD43loIgM+IgD−) and Mature (PI−B220+CD43loIgM−IgD+) B cells. Error bars represent mean ± SEM. For flow cytometric analysis n= 3 for WT and CD19-Cre; Gcn5Fx/Fx mice. All p-values determined by unpaired Student’s t-test. *p≤ 0.05; **p≤ 0.01; ***p≤ 0.001; ****p≤ 0.0001. D. Representative FACS analysis of cells size as measured by forward scatter (FCS-A) of B220+CD19+ B cells from. 5-6-week-old Eμ-Myc and Eμ-Myc; Gcn5Fx/Fx mice (n=3). Black curve is Eμ-Myc. Red curve is Eμ-Myc; Gcn5Fx/Fx.
