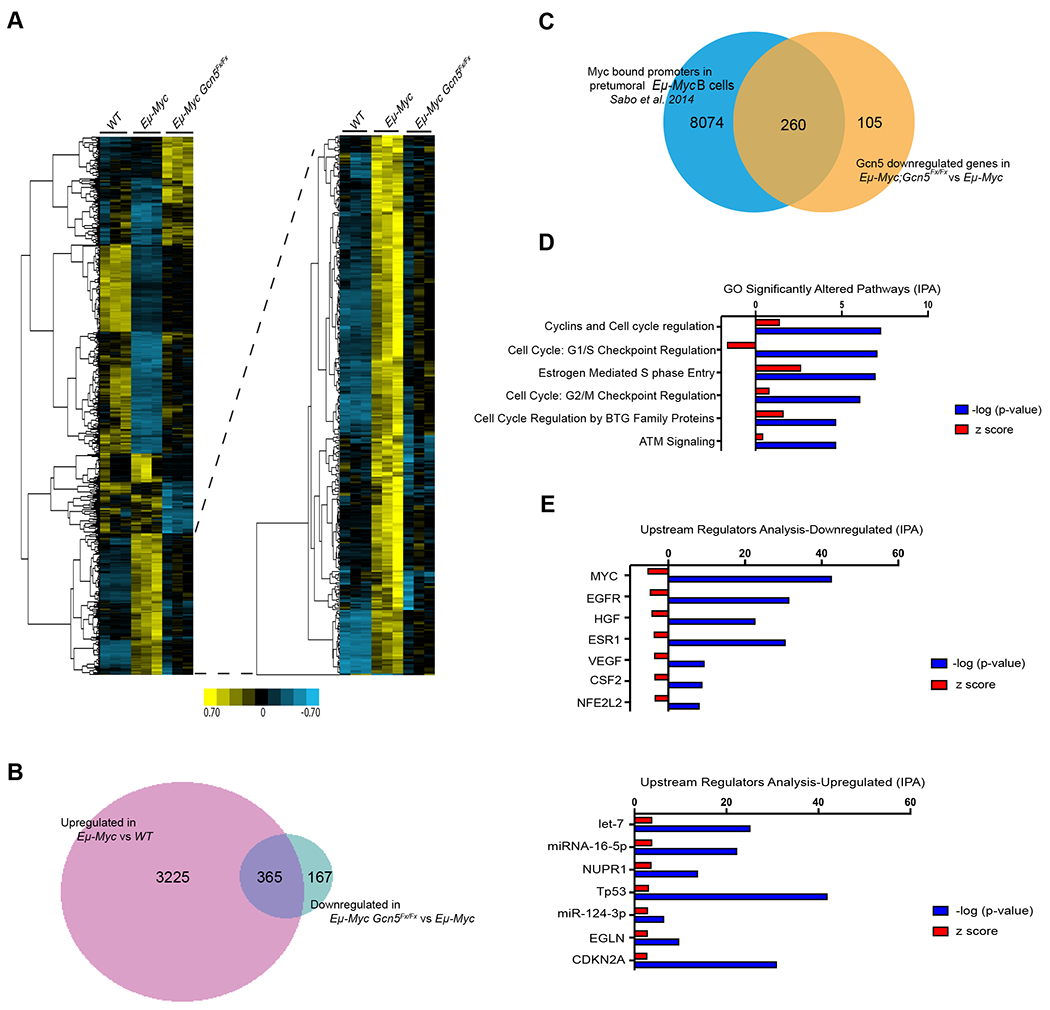
Figure 4. Overview of differential gene expression in Gcn5 floxed Eμ-Myc mice.

A. Heatmap of gene expression profiles from CD19+ splenic B cells. Expression profiles of CD19+ B cells of 5-6-week-old WT, Eμ-Myc, and Eμ-Myc; Gcn5Fx/Fx mice. (n=3). Yellow and blue indicate up and down regulation relative to the median expression of each gene respectively. B. Venn diagram of genes that were upregulated in Eμ-Myc (3558 genes) compared with downregulated in the Gcn5 floxed B cells (532 genes). C. Comparison of a published dataset of Myc-bound promoters in pretumorous B cells from Eμ-Myc mice to genes down regulated in pretumorous B cells from Eμ-Myc vs Eμ-Myc; Gcn5Fx/Fx mice. D. GO analysis of significantly altered pathways by IPA. E. Predicted upstream regulators whose expression change can lead to the down regulation of genes upon deletion of Gcn5 as compare to Eμ-Myc mice.
