
Figure 2.
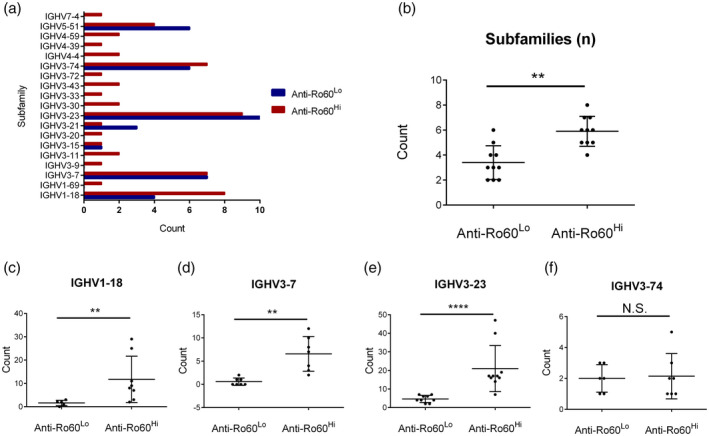
Mass spectrometric profiling of anti‐Ro60 in anti‐Ro60low and anti‐Ro60high subsets. **P < 0·01, ****P < 0·0001; n.s. = not significant.
Official websites use .gov
A
.gov website belongs to an official
government organization in the United States.
Secure .gov websites use HTTPS
A lock (
) or https:// means you've safely
connected to the .gov website. Share sensitive
information only on official, secure websites.
Mass spectrometric profiling of anti‐Ro60 in anti‐Ro60low and anti‐Ro60high subsets. **P < 0·01, ****P < 0·0001; n.s. = not significant.