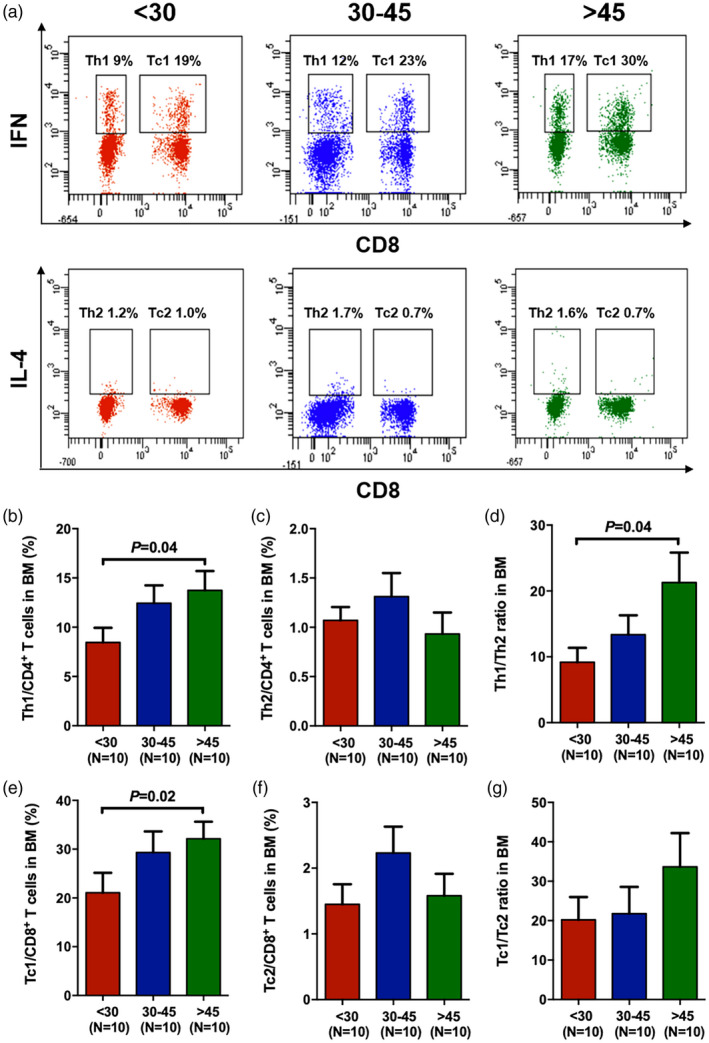
Fig. 4.

Reduced frequencies of T helper type 1 (Th1) and T cytotoxic type 2 (Tc1) cells in the bone marrow (BM) of young donors. Representative flow cytometry analyses of Th1 [CD3+CD8−interferon (IFN)‐γ+], Tc1 (CD3+CD8+IFN‐γ+), Th2 [CD3+CD8−interleukin (IL)‐4+] and Tc2 (CD3+CD8+IL‐4+) cells from the three donor age groups (a). The percentages of BM Th1 (b) and Th2 (c) cells among CD4+ T cells and Tc1 (e) and Tc2 (f) cells among CD8+ T cells. The ratios of Th1/Th2 (d) and Tc1/Tc2 (g) in the BM of the three donor age groups. The results are expressed as the mean ± standard error of the mean (s.e.m.). All P‐values < 0·05 were considered significant and are provided in the figure.
