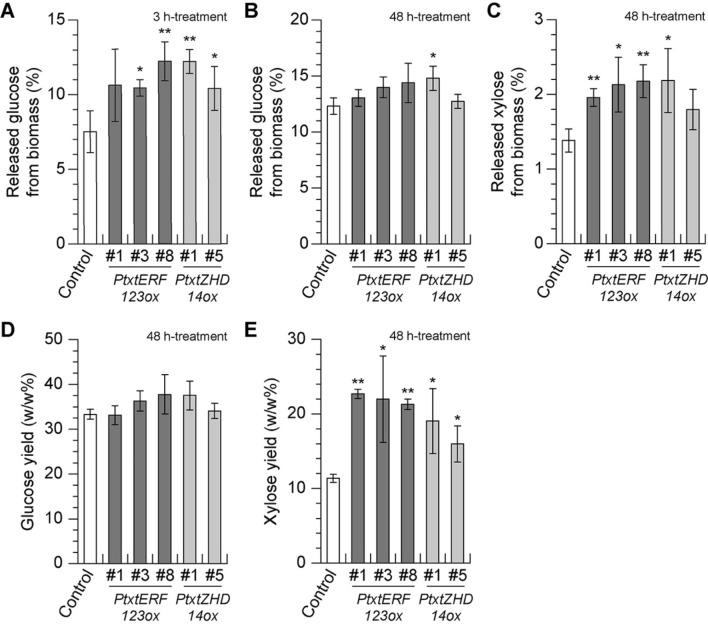
Figure 3.
The enzymatic saccharification of Pt × tERF123ox, and Pt × t ZHD14ox lines grown in the soil, in comparison to the controls (GFP-TUA6). Released glucose (A,B) and xylose (C) amounts from biomass (wt/wt %) after 3 h (A) or 48 h (B,C)-treatments with cellulase cocktail. Glucose and xylose yields (D,E) calculated based on a total of glucan (non-crystalline glucan and crystalline glucan) and xylan measured in Table 2. Data are shown as mean ± standard deviations of biological triplicates. Single and double asterisk(s) indicate P value < 0.05 and < 0.01, respectively in Student’s t- test when compared with the control plants.

