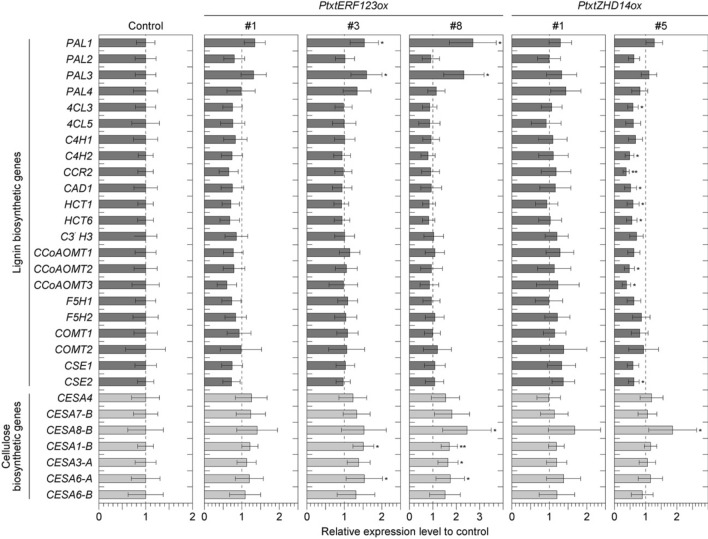
Figure 4.
Relative expression level of a total of 29 genes involved in lignin and cellulose biosynthesis in seedling stems of Pt × tERF123ox, and Pt × t ZHD14ox lines grown for one-month in MS culture under aseptic condition, in comparison to the controls (GFP-TUA6). Expressions were measured by real-time PCR by using gene specific primer pairs listed in Table S1, expression levels between samples were normalized by using 18S ribosomal RNA gene expression, and then relative expressions were calculated by using expression levels in control as 1. Data are shown as mean ± standard deviations of biological triplicates. Single and double asterisk(s) indicate P value < 0.05 and < 0.01, respectively in Student’s t- test when compared with the control plants.

