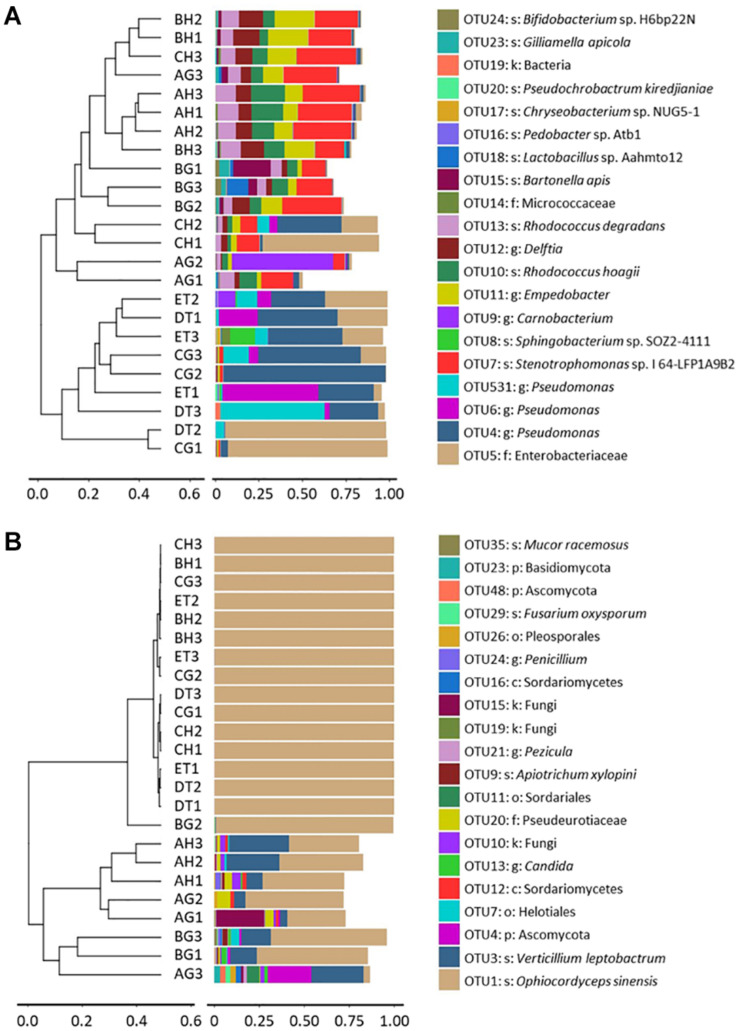
FIGURE 4.
Clustering analysis of beta-diversity based on the Bray–Curtis distance matrix for bacterial (A) and fungal (B) communities of all samples by the UPGMA method. AH and AG, hemolymph and gut of un-injected living larvae; BH and BG, hemolymph and gut of living larvae with high blastospore load; CH and CG, freshly mummifying larvae without mycelia coating; DT, tissues of the mummified larvae coated with mycelia; ET, tissues of the completely mummified larvae with mycelia.

