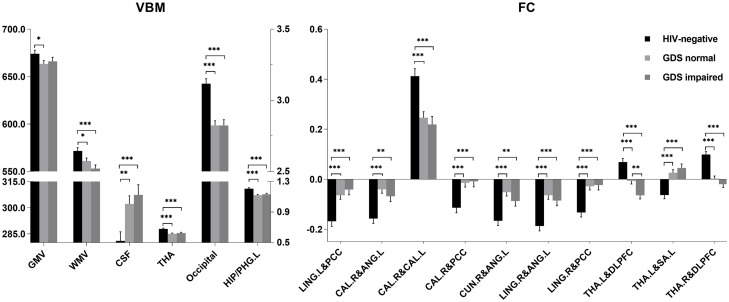
FIGURE 3.
Volume (ml) and functional connectivity (FC) (Z-score) differences among HIV-negative controls, global deficit score (GDS) normal, and GDS impaired groups. For voxel-based morphometry (VBM) analysis, the left Y-axis is the volume of gray matter (GM), white matter (WM), and cerebrospinal fluid (CSF), and the right Y-axis is the volume of thalamus (THA), occipital, and left hippocampus/parahippocampus (HIP/PHG.L). ∗P < 0.05; ∗∗P < 0.01; ∗∗∗P < 0.001. Least significant difference (LSD) for multiple comparison correction. LING.L, left lingual; PCC, posterior cingulate cortex; CAL.R, right calcarine; CAL.L, left calcarine; CUN.R, right cuneus; ANG.L, left angular; LING.R, right lingual; DLPFC, dorsal lateral prefrontal cortex; THA.L, left thalamus; THA.R, right thalamus; SA.L, left somatosensory association cortex.

