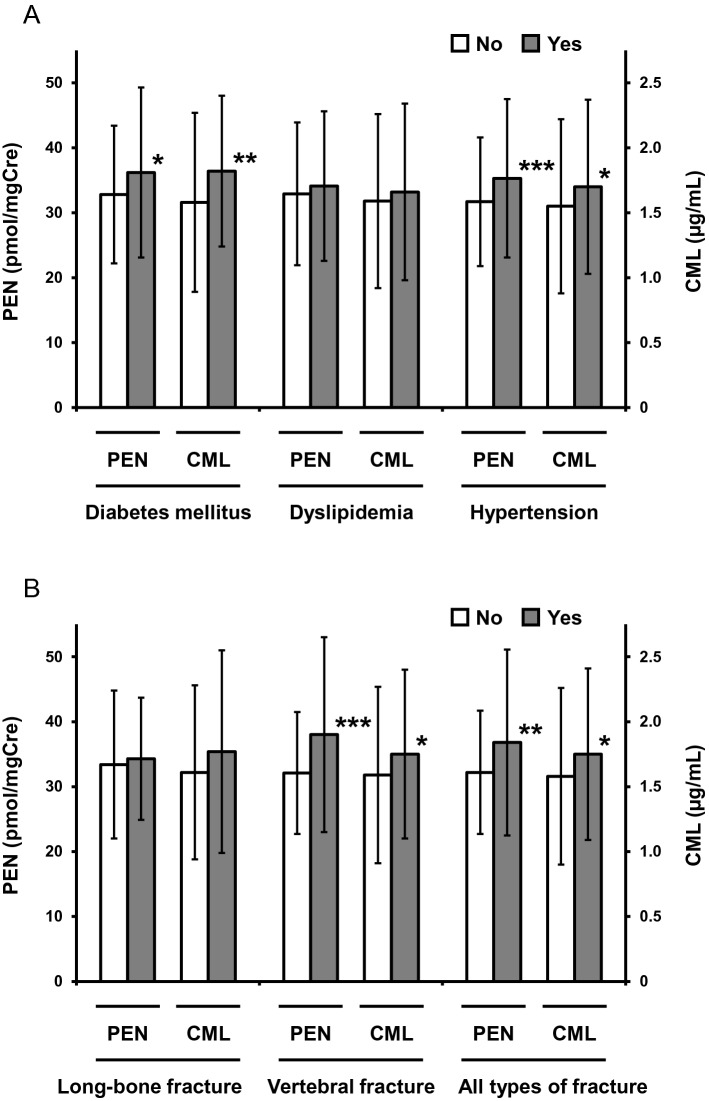
Figure 2.
AGE levels according to the presence of co-morbidities and prevalent fractures. Mean ± SD values of PEN (left axis) and CML (right axis) in patients with or without (A) co-morbidities and (B) prevalent fractures are presented. Asterisks indicate significant differences vs. patients without each disorder evaluated by Student's t-test (*P < 0.05, **P < 0.01, and ***P < 0.001). AGE advanced glycation end product, SD standard deviation, PEN pentosidine, CML carboxymethyl-lysine.

