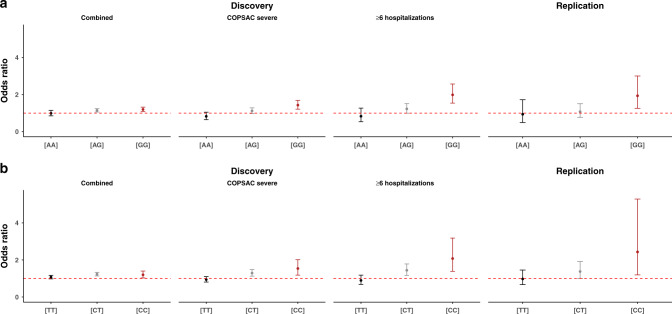
Fig. 3. Stratified FUT2 (rs601338) and ABO (rs505922) effects in the discovery and replication stages.
For the discovery stage, the effects are shown in strata with increasing phenotype severity, namely the overall stratified results (iPSYCH + COPSACsevere), COPSACsevere, and the cases with six or more hospitalizations from COPSACsevere. a illustrates the ABO effect stratified on the FUT2 genotypes (AA, AG, and GG). b illustrates the FUT2 effect stratified on the ABO genotypes (TT, CT, and CC). For the discovery analyses, the stratified logistic regression model is adjusted for ten principal components and sex. Replication analyses are adjusted for sex and cohort status. Coloring of the error bars represents the different genotype groups. Error bars represent the 95% confidence interval for each stratified estimate. The estimate is represented by the circles. Ncombined = 68,281 (Ncases = 2866, Ncontrols = 65415). = 6532 (Ncases = 1204, Ncontrols = 5328), N ≥ 6hospitalizations = 5707 (Ncases = 379, Ncontrols = 5328). Nreplication = 918 (Ncases = 191, Ncontrols = 727).

