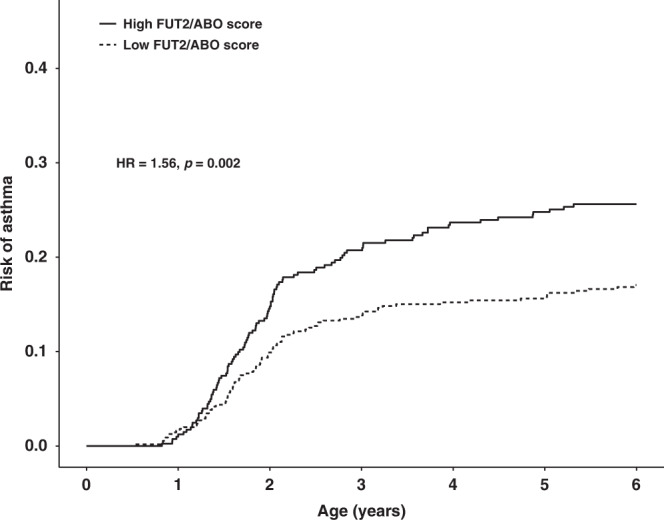
Fig. 4. Kaplan–Meier curve illustrating the effect of the FUT2–ABO risk score on estimated risk of childhood asthma in the COPSAC birth cohorts (replication).

A high FUT2–ABO score corresponds to individuals with a score > 0, and a low score corresponds to the remaining individuals with a score < 0. Hazard ratio and P value are estimated using a Cox proportional-hazard model. The model was adjusted for sex and cohort status. N = 918 (Ncases = 191, Ncontrols = 727). The FUT2–ABO score was based on rs601338 (FUT2) and rs505922 (ABO).
