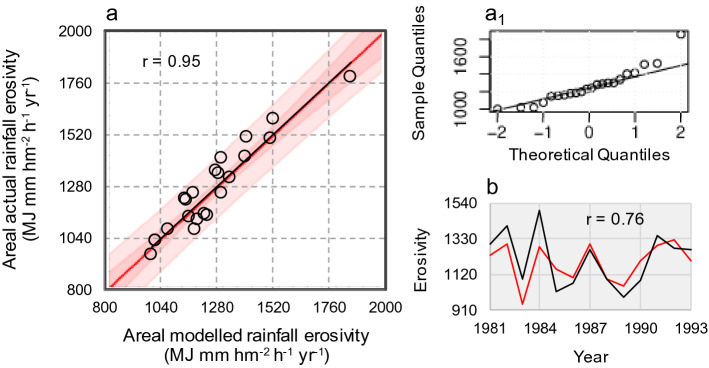
Figure 3.
Model calibration and validation. (a) Scatterplot of regression model (black line, Eq. (1) and red line of identity) vs. actual rainfall erosivity estimated upon the MedCA over the period 1994–2015, with the inner bounds showing 90% confidence limits (power pink coloured area), and the outer bounds showing 95% prediction limits for new observations (light pink). (a1) related QQ-plot of residuals at calibration stage. (b) Time co-evolution (1981–1993) of actual (black curve) and estimated (red curve) of rainfall erosivity at validation stage (in a,b, r stands for linear correlation coefficient).

