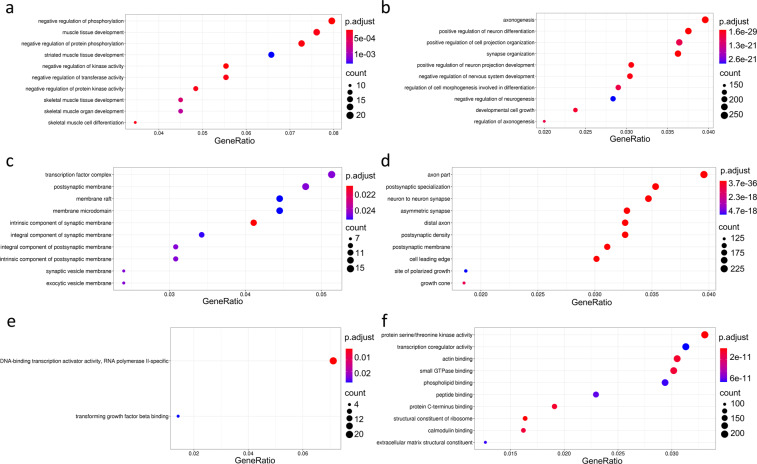
Fig. 7.
Analysis of enriched gene ontology (GO) terms for DEGs at short and long time points after stress. The plots represent the first ten most significantly over-represented gene ontology terms in the biological process (a,b), cellular component (c,d) and molecular function (e,f) categories, for the list of genes differentially expressed after a short (<=24 hours) (a,c,e) or long (>24 hours) (b,d,f) delay after the end of stress. The size of each dot represents the number of genes enriched in that term, while the color represents the corrected p-value. p.adjust < 0.05 was considered significant.

