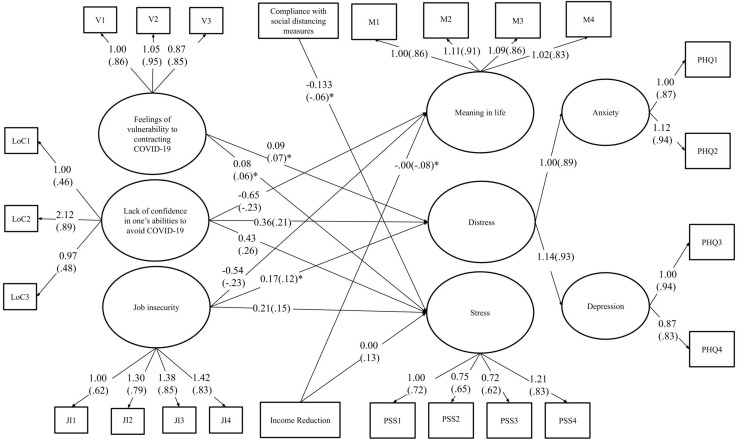
FIGURE 2.
Final model of the pathways between potential risk factors and wellbeing outcomes. The estimates in brackets are standardized while those not presented in brackets are unstandardized. All connections illustrated are significant at p ≤ 0.001, except for those with an asterisk (*) which indicates that the effect is significant at p ≤ 0.05. Control variables were included when conducting the analysis, but were excluded from the figure for reading ease.

