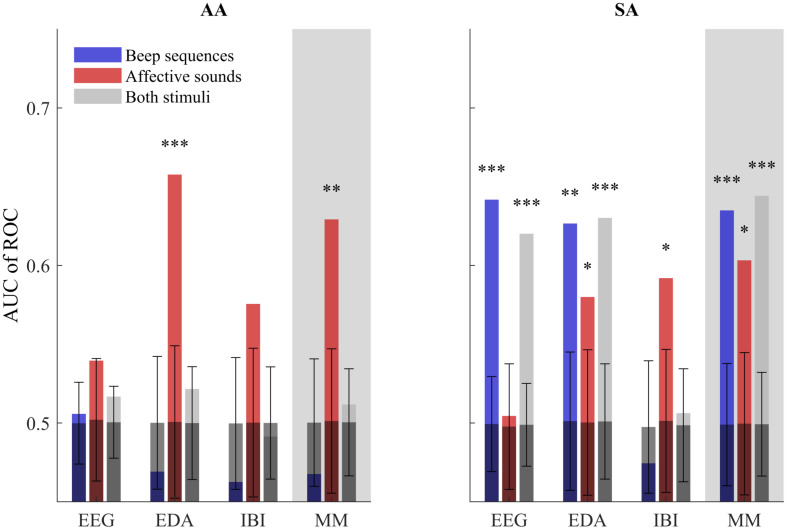
FIGURE 2.
AUC of ROC metric of stimulus detection performance using PS in EEG, EDA, IBI and a multi-modal combination of the three (MM). Performance is shown for the AA and SA groups, when considering only beep blocks or emotional sounds as true positives and when considering both types of stimuli as true positives. In addition, the mean and standard deviation chance level detection performance based on 1,000 renditions with randomized stimulus timing is shown with test results comparing detection performance to chance level (∗p < 0.05,∗∗p < 0.01, ∗∗∗p < 0.001). Note that for the AA group, the emotional sounds but not the beeps are expected to draw (bottom-up) attention, i.e., for the AA group we expect high AUC for emotional sounds only. For the SA group, both beep sequences and emotional sounds are relevant and expected to draw attention.

