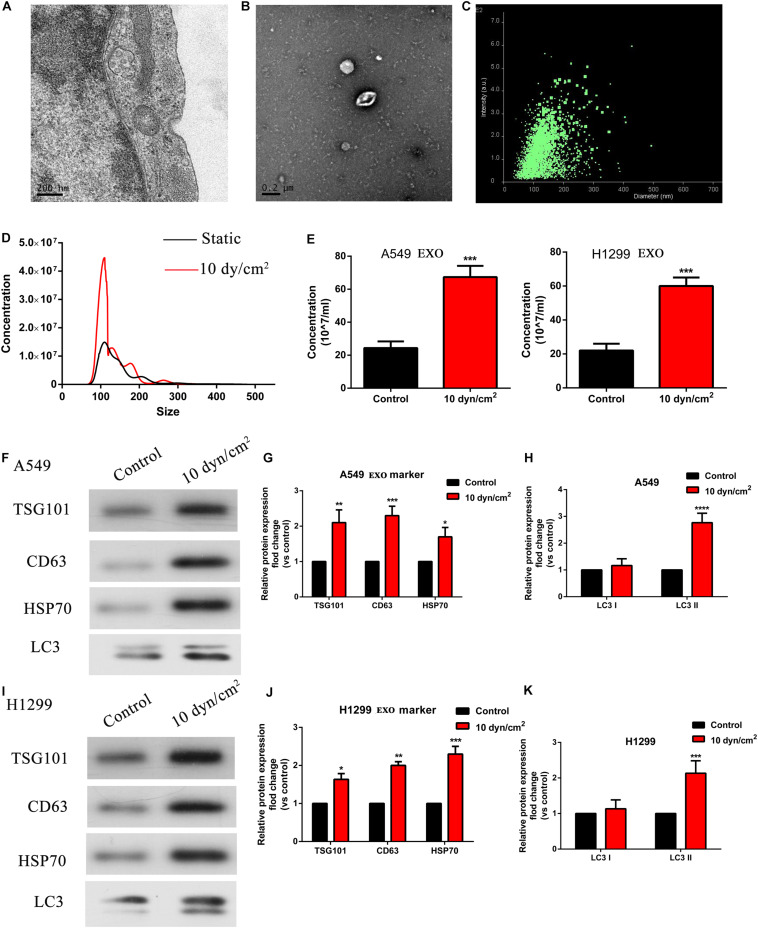
FIGURE 2.
ASS promoted exosomes and autophagy related components release. (A,B) A549 cells derived exosomes observed by TEM, Scale bar, 200 nm. (C) The intensity and size of exosomes as evaluated by NANOSIGHT. (D,E) The concentration of exosomes isolated from A549 and H1299 cells after exposure to ASS for 60 min as acquired by Nanoparticle Tracking Analysis (NTA), ***P < 0.001. (F–K) Expression of exosomes maker (TSG101, CD63, and HSP70) and autophagy component maker (LC3I/II) were measured by western blot analysis, every experiment was repeated in triplicate, *P < 0.05, **P < 0.01, ***P < 0.001, ****P < 0.0001.

