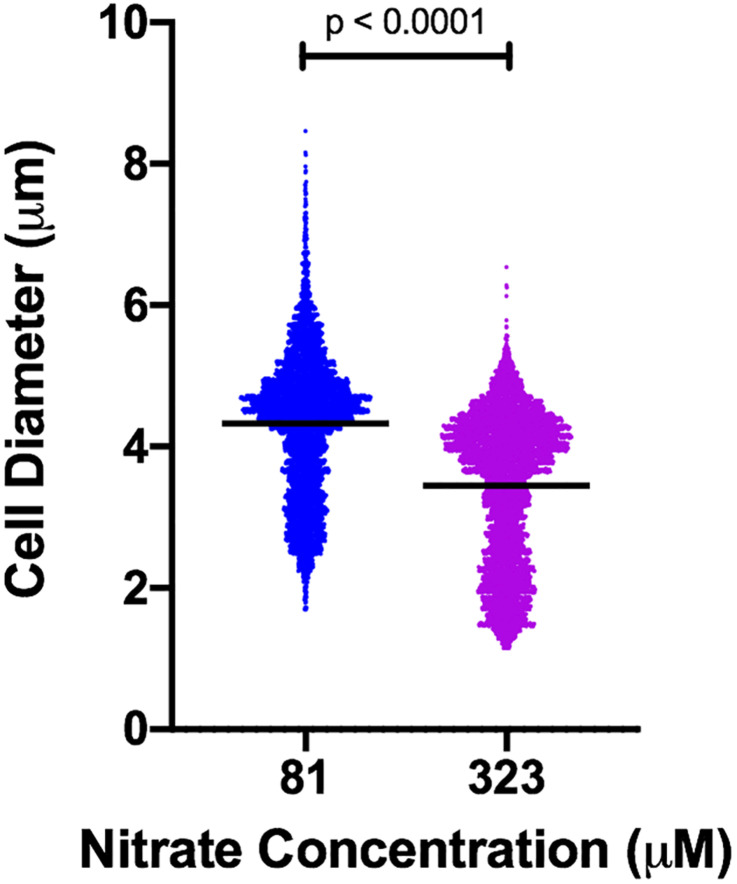
FIGURE 1.
Violin plot of cell diameter in cultures of M. aeruginosa PCC 7806 grown in different concentrations of nitrate. Black horizontal bars represent mean diameter. Each measured cell is represented by a plotted point. Width of plot is proportional to frequency of cells at a given diameter. n = 4,890 (81 μM); n = 5,213 (323 μM). p-value from Mann–Whitney test.

