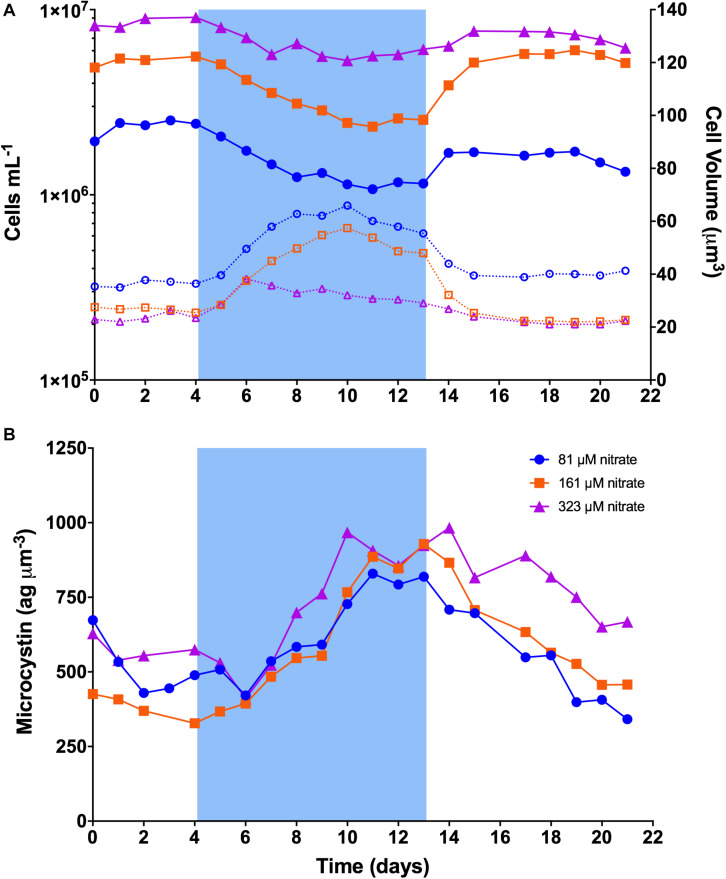
FIGURE 2.
Dynamics of cell concentration, cell volume, and cellular microcystin concentration in continuous cultures of M. aeruginosa PCC 7806. Blue shading represents the time period when temperature was set to 19°C. (A) Cell concentration and cell volume. Solid lines represent cell concentration on the left y-axis. Dashed lines represent cell volume on the right y-axis. (B) Cellular microcystin concentration.

