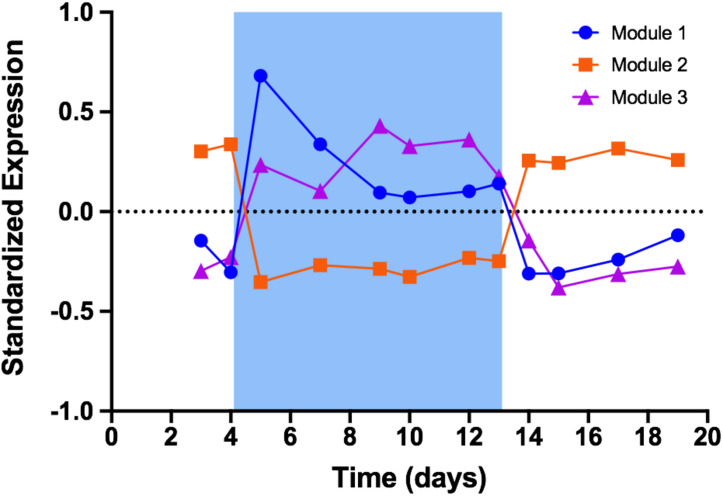
FIGURE 3.
Standardized expression profiles of eigengenes from WGCNA modules. Blue shading represents time period when temperature was set to 19°C. Module 1 represents 673 genes that were quickly and sharply upregulated during cold stress. Module 2 represents 441 genes that were downregulated during cold stress. Module 3 represents 379 genes that were upregulated during cold stress but on a timescale distinctly different from that of module 1.

