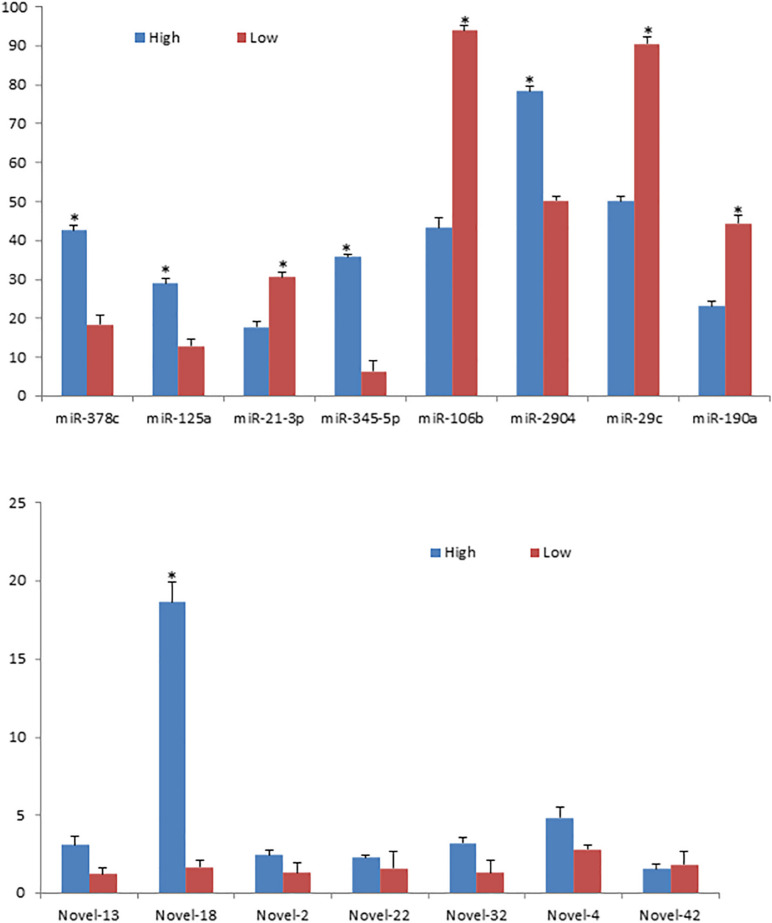
FIGURE 4.
mRNA expression levels of the 15 randomly selected miRNAs validated with qRT-PCR. *indicates p < 0.05. Blue columns represent the relative miRNA expression levels by qRT-PCR normalized by U6 in the high group and red columns represent the relative miRNA expression levels by qRT-PCR normalized by U6 in the low group.

