Figure 1.

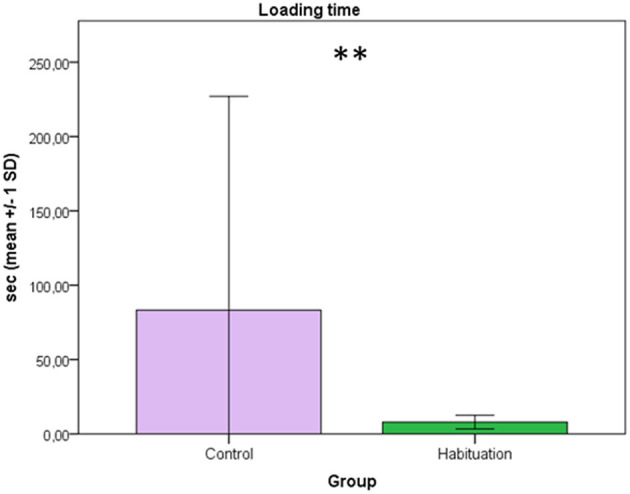
The time (sec) for loading is presented on the y-axis (mean ± 1 SD) with the groups (control vs. habituation) on the x-axis (Mann-Whitney test; **p = 0.004).

The time (sec) for loading is presented on the y-axis (mean ± 1 SD) with the groups (control vs. habituation) on the x-axis (Mann-Whitney test; **p = 0.004).